Written by R.W. Baird analyst David J. Manthey, CFA with Quinn Fredrickson, CFA 5/7/23
Key Takeaway:
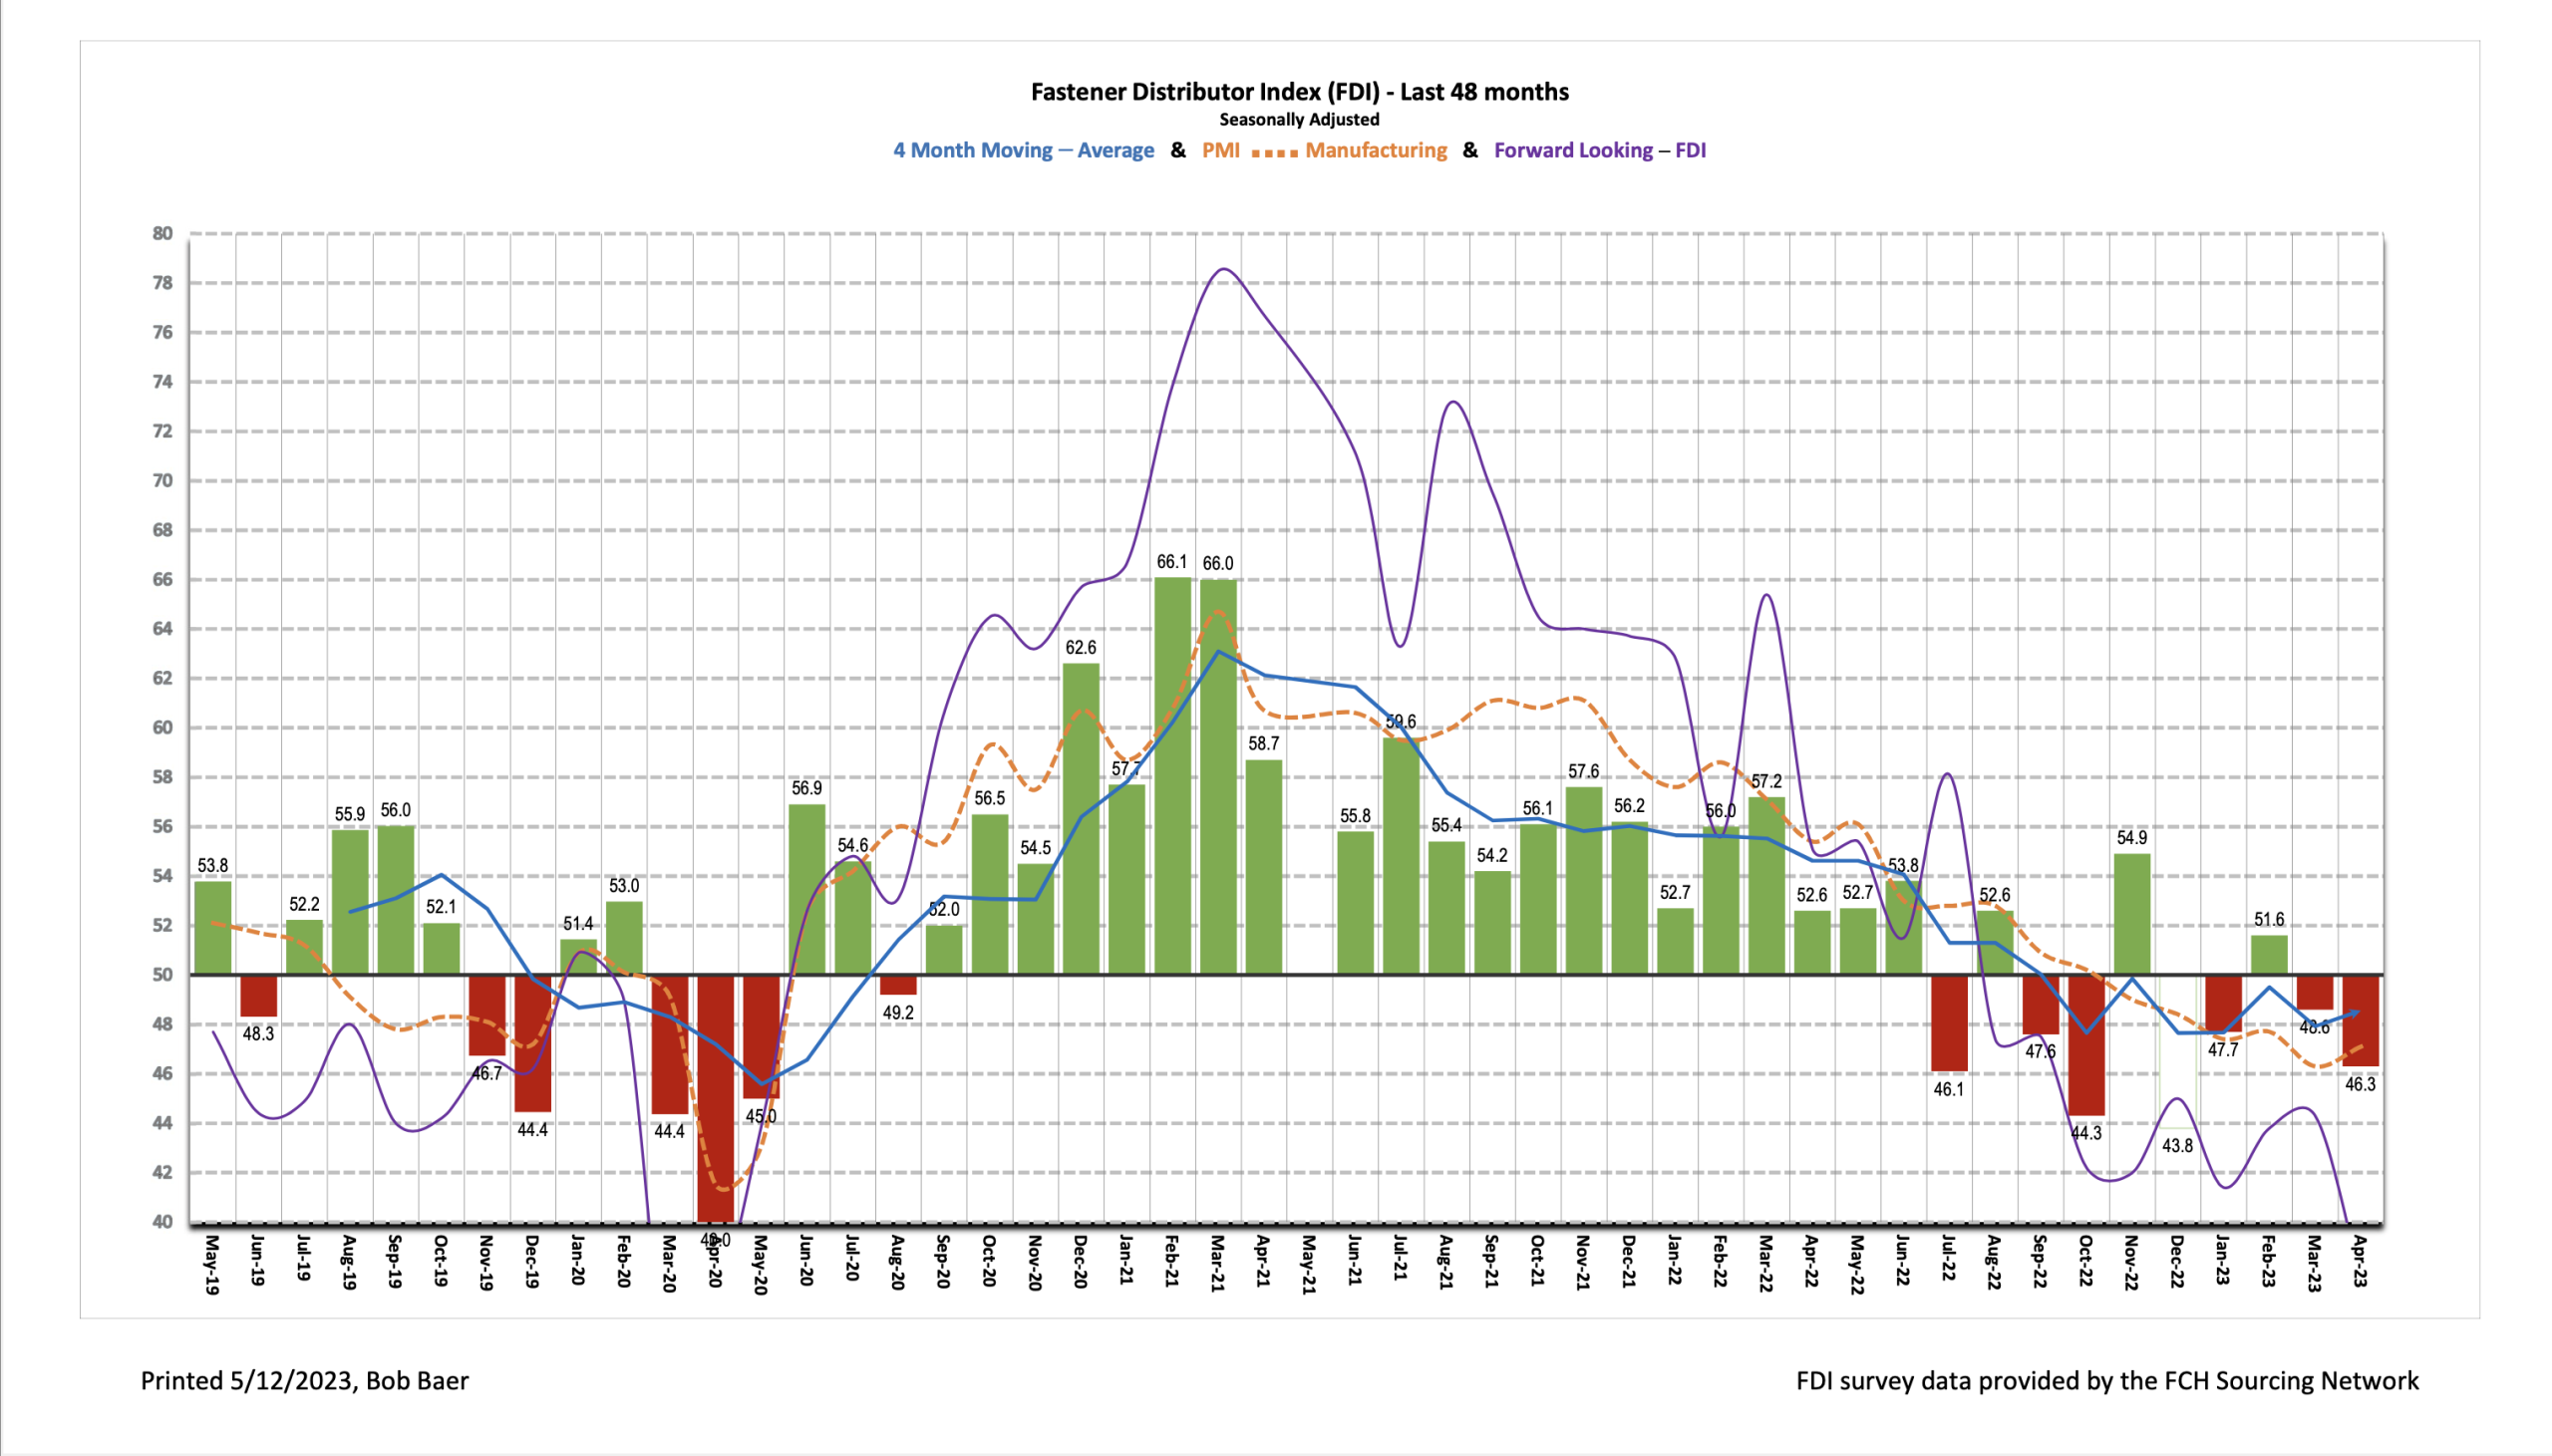
The seasonally adjusted Fastener Distributor Index (FDI) weakened further to 46.3 compared to 48.6 in March. Respondents indicated raw material shortages and declining prices/margins were the primary drags in April. The Forward-Looking Indicator (FLI) also softened to just 37.8 (March 44.3). Overall, the FDI/FLI results suggest conditions remain soft in the fastener market.
About the Fastener Distributor Index (FDI). The FDI is a monthly survey of North American fastener distributors, conducted with the FCH Sourcing Network and R.W. Baird. It offers insights into current fastener industry trends/outlooks. Similarly, the Forward-Looking Indicator (FLI) is based on a weighted average of four forward- looking inputs from the FDI survey. This indicator is designed to provide directional perspective on future expectations for fastener market conditions. As diffusion indexes, values above 50.0 signal strength, while readings below 50.0 signal weakness. Over time, results should be directly relevant to Fastenal (FAST) and broadly relevant to other industrial distributors such as W.W. Grainger (GWW) and MSC Industrial (MSM). Additional background is available at:FastenersClearingHouse.com.
Key Points:
FDI continues to soften m/m. The seasonally adjusted April FDI (46.3) retrenched further vs. last month’s 48.6, the second consecutive month of moderation. Three of the four components of the FDI (sales, employment, and supplier deliveries) saw sequential declines, while only the customer inventories index was higher m/m. Respondents indicate that normalizing supply chain is leading to lower pricing and margin pressure, providing a headwind to the overall FDI index. The sales index, specifically, came in at 45.0 in April vs. 55.6 last month. “Slowing” was a consistent theme across most demand commentary.
FLI also significantly weaker. The FLI registered a 37.8 reading, declining significantly from March’s 44.3 and remaining at sub-50 levels which indicates further weakening is expected ahead. Softer readings in the employment, customer inventory levels, and six-month outlook indexes drove the reduction. On the six-month outlook, just 20% of respondents expect activity levels to be higher six months from now vs. today compared to 25% in March, another 40% expect similar activity vs. 44% in March, and 40% anticipate lower activity vs. 31% last month. Visibility to near-term expectations remains limited for most participants but most anticipate steady or weaker demand – rather than acceleration.
FDI employment also lower m/m. The FDI employment index came in at 46.3 for April vs. 54.2 last month. Employment remains at generally appropriate levels for the vast majority of respondents (73% of responses). However, there was a slight uptick in the percentage selecting “too low” for employment levels at 18% vs. 3% in March. Another 10% of participants consider their employment levels “too high” – relatively consistent with 11% in March. Turning to the overall economy, the April jobs report came in well above expectations, with 253,000 jobs added vs. economist expectations for +180,000.
Outlook less positive on balance. The six-month outlook was slightly lower this month when compared with March, coming in at 40.0 vs. 47.2. Several respondents expressed expectations/hope for relative stability ahead: “Raw material continues to be a challenge. Shortage and cost increases. Overall business is steady, with a positive short-term outlook for the future,” and “Our sales were down compared to the preceding mainly due to short business days. The daily average was actually strong. Barring any major disruptions (i.e. debt ceiling fight), [I] expect the market conditions to be steady. That was reinforced by a recent economic presentation at PacWest meeting.” Others struck a less optimistic tone, however, with key concerns around pricing/margin erosion emerging: “Prices have dropped significantly owing to supply chain clear-up and soaring inventories at the master distributor levels. This is coupled with customers slashing inventories in anticipation of a recession. It’s squeezing margins for everyone as supplies are fighting to turn inventories into much-needed cash. (And you can quote me on that!).” Echoing this, another commented, “Inventories still high but starting to move. Inquiries have yet to pick up from Feb / Mar / April. Margins taking a hit as we ship out high priced product that arrived over the last 12 months. Overseas pricing becoming more competitive.” Lastly, several participants saw noticeable slowing in activity and bookings: “Activity is slowing across most sectors” and “April sales 5% below first quarter average and April bookings 10% below first quarter average.”
Fastenal reported April daily sales growth of +7.8%, above our +5.9% estimate but still below normal seasonality. This included just +1.2% y/y growth in fasteners, +10.1% growth in safety, and +12.1% other non-fastener growth. Looking forward, we model May daily sales +5.0% y/y which is also below days- adjusted normal seasonality given the soft FDI/FLI results. Looking at 2023 overall, we generally model slightly weaker-than-seasonally-normal sales amid our over-arching assumption that recession hits in 2H23.
Risk Synopsis
Fastenal: Risks include economic sensitivity, pricing power, relatively high valuation, secular gross margin pressures, success of vending and on-site initiatives, and ability to sustain historical growth.
Industrial Distribution: Risks include economic sensitivity, pricing power, online pressure/competitive threats, global sourcing, and exposure to durable goods manufacturing.
For the full FDI report for April 2023, with graphs and disclosures, Click-here.