Written by R.W. Baird analyst David J. Manthey, CFA with Quinn Fredrickson, CFA 6/7/23
Key Takeaway:
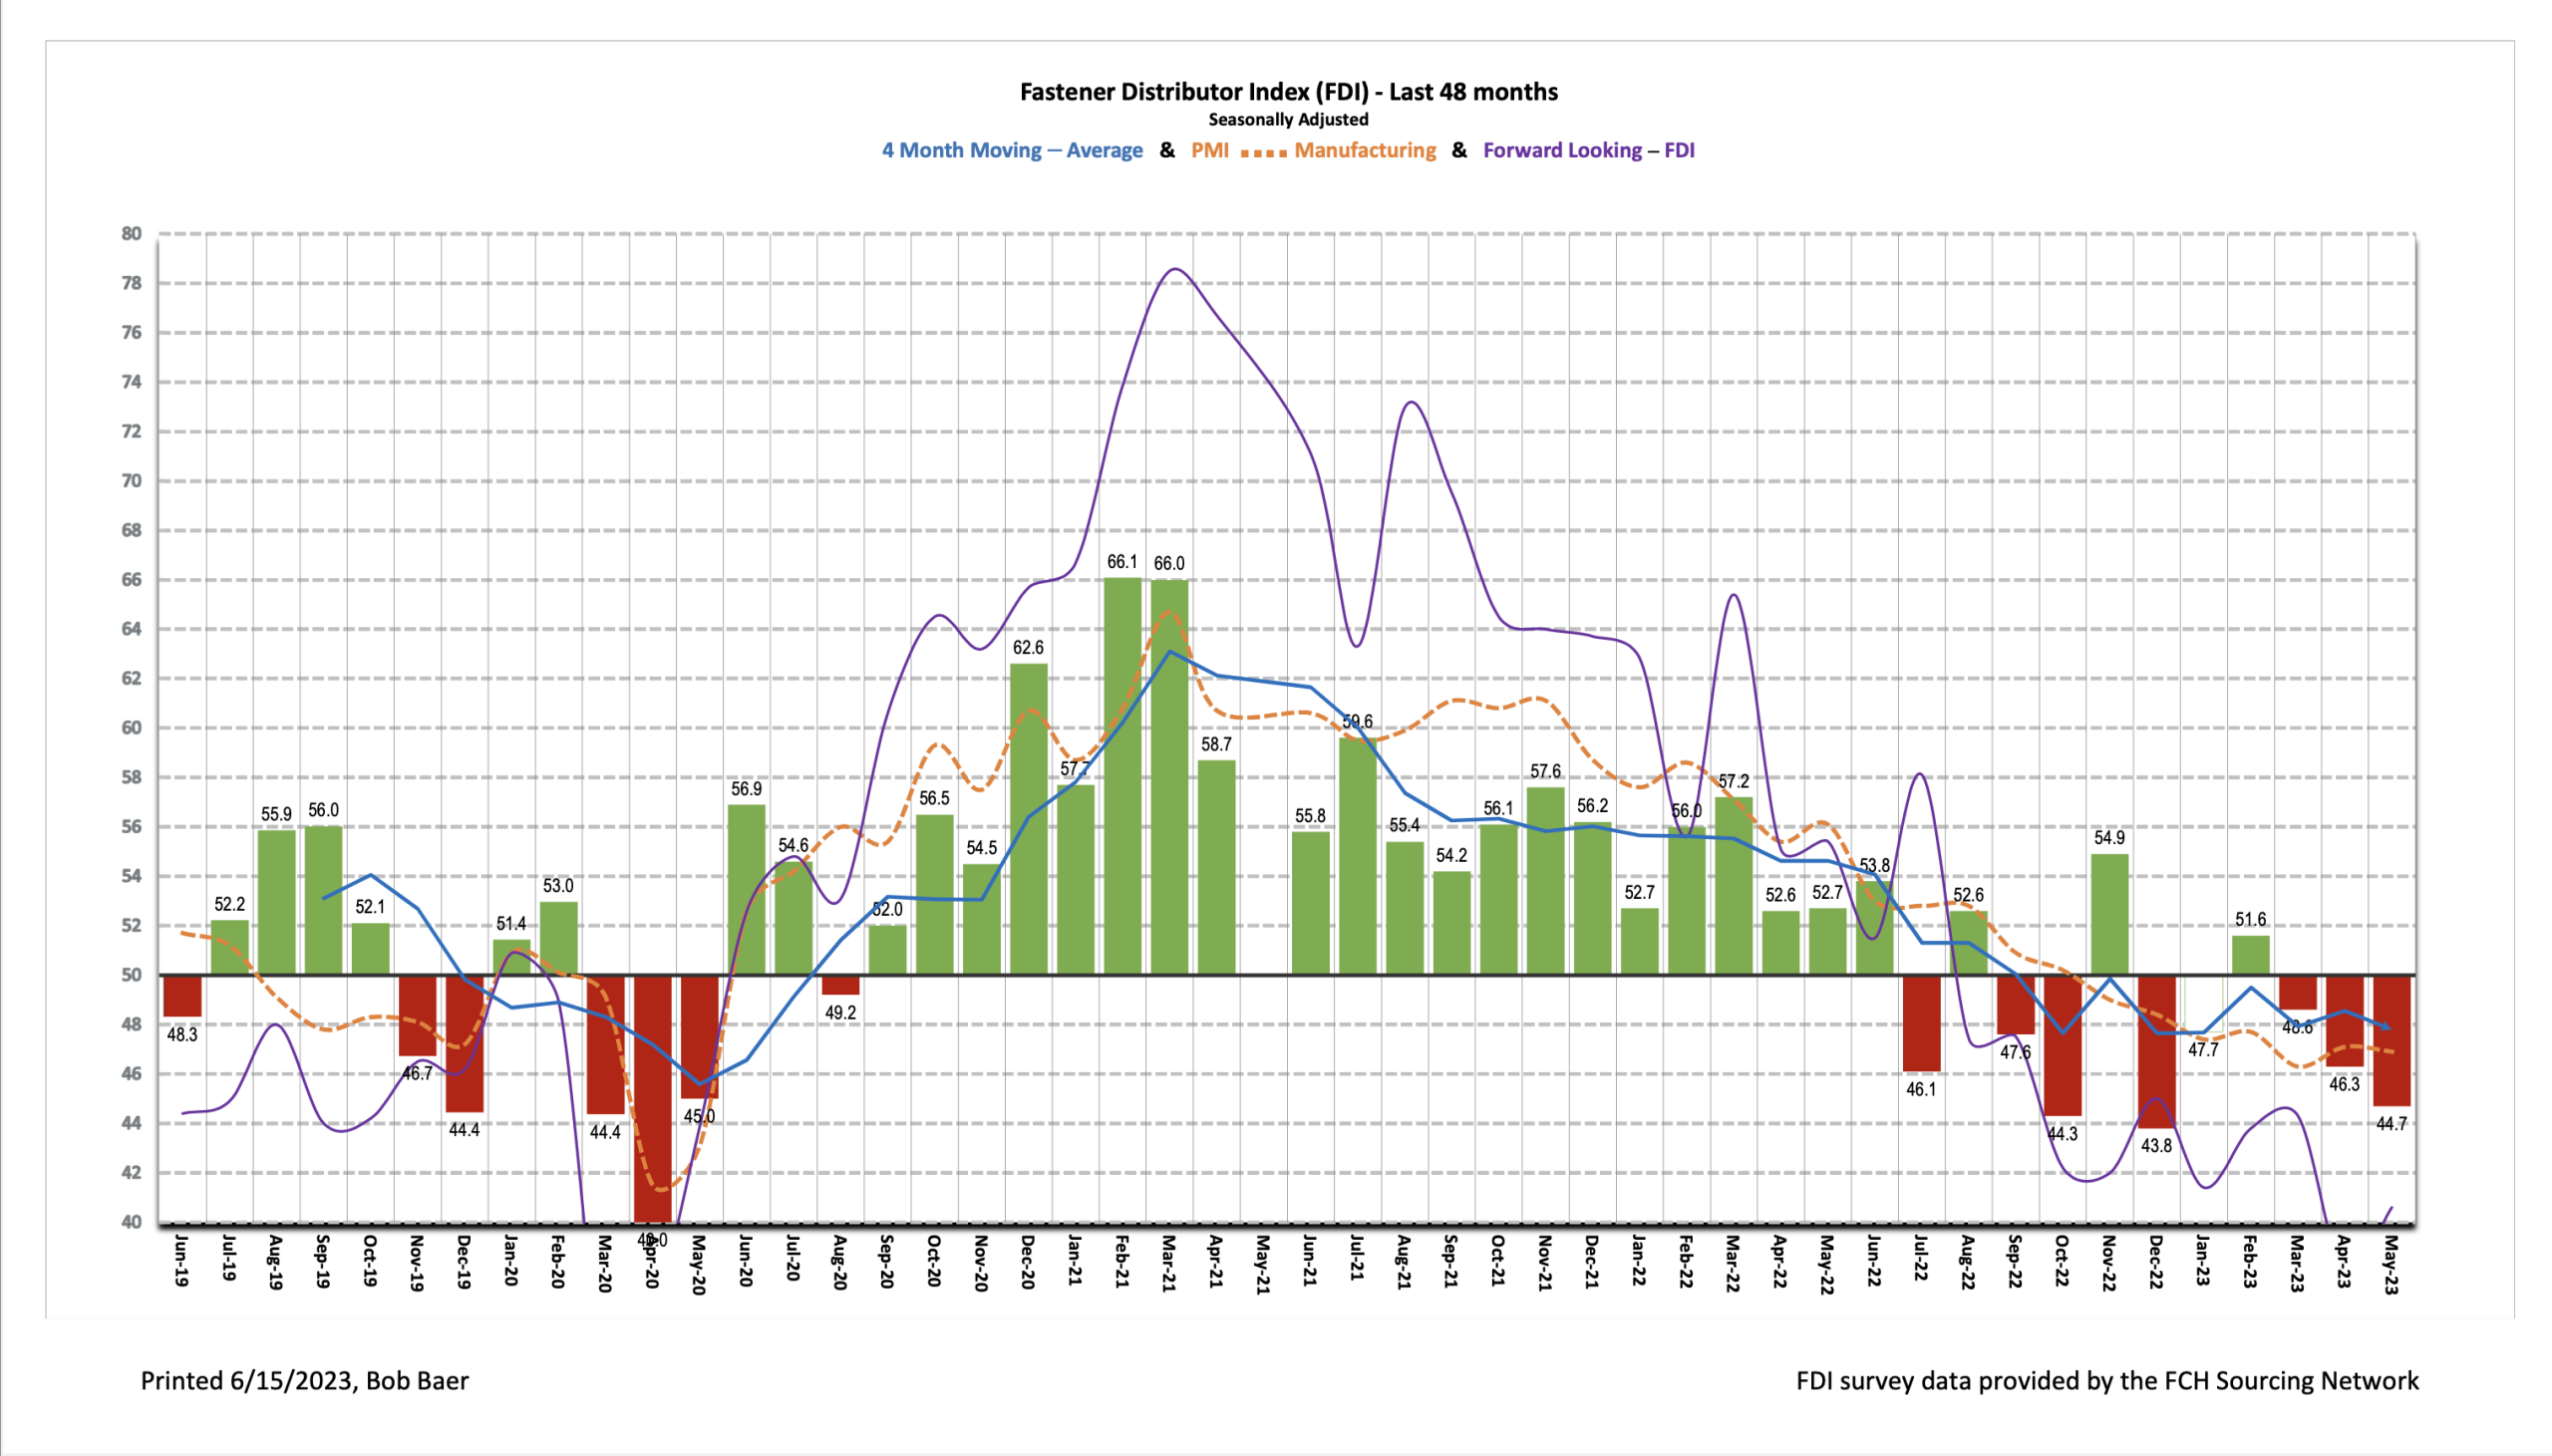
The seasonally adjusted Fastener Distributor Index (FDI) weakened further to 44.7 compared to 46.3 in April. Respondents pointed to declining new business opportunities and general softening in the economy as the driver of the m/m decline. The Forward-Looking Indicator (FLI) improved slightly, albeit remaining well below the neutral-50 reading, reading 40.6 vs. April 37.8. Overall, the FDI/FLI results and Fastenal’s daily sales both suggest conditions remained soft in the fastener distribution market in May.
About the Fastener Distributor Index (FDI). The FDI is a monthly survey of North American fastener distributors, conducted with the FCH Sourcing Network and R. W. Baird. It offers insights into current fastener industry trends/outlooks. Similarly, the Forward-Looking Indicator (FLI) is based on a weighted average of four forward- looking inputs from the FDI survey. This indicator is designed to provide directional perspective on future expectations for fastener market conditions. As diffusion indexes, values above 50.0 signal strength, while readings below 50.0 signal weakness. Over time, results should be directly relevant to Fastenal (FAST) and broadly relevant to other industrial distributors such as W.W. Grainger (GWW) and MSC Industrial (MSM). Additional background is available at:FastenersClearingHouse.com.
Key Points:
FDI a touch weaker m/m. The seasonally adjusted May FDI (44.7) retrenched slightly further vs. last month’s 46.3, the third consecutive month of moderation. Two of the four components of the FDI (sales and customer inventories) saw sequential declines, while the employment and supplier deliveries indices improved m/m. One respondent provided commentary that “new business opportunities have been in decline for about three months or more,” which is consistent with the seasonally adjusted sales index’s continued fall to 35.9 in May from 51.4 in February, which has been a large contribution to the overall decline in the FDI over that timeframe.
FLI improves off low base. The FLI registered a 40.6 reading, rebounding from April’s 37.8 but remaining well below 50 which indicates further weakening is expected ahead. Stronger readings in the employment index and lower customer inventory levels drove the m/m improvement, while a weaker six-month outlook partially offset. Just 11% of respondents expect activity levels to be higher six months from now vs. today compared to 20% in April. Another 48% expect similar activity vs. 40% in April, while 41% anticipate lower activity vs. 40% last month. Visibility to future conditions and hence budgeting remains challenging given mixed economic signals, but most participants indicated they view further weakening ahead as inevitable. As one respondent said, “Mixed economic signals continued to push and pull our business. Unemployment rate continues to surprise, interest rates continue to rise, and our industry remains hard to predict.”
FDI employment higher m/m. The FDI employment index came in at 55.6 for May vs. 46.3 last month. Employment remains at generally appropriate levels for the vast majority of respondents (74% of responses). Additionally, there was a reduction in the percentage selecting “too low” for employment levels at 7% vs. 18% in April, and another 19% of participants consider their employment levels “too high” – elevated from 10% in April. This is very consistent with the broader economy, as the May jobs report came in well above expectations with 339,000 jobs added vs. economist expectations for +190,000.
Outlook remains more bearish on balance. The six-month outlook was reduced again this month when compared with last month, coming in at 35.2 vs. 40.0. For reference, “peak optimism” post pandemic occurred in March 2021 with the six-month index at 90.6 and 88% of participants expecting better activity levels six months ahead. Several participants expressed a sense of inevitability for slowing ahead: “While the expected recession hasn’t hit, most of our vendors and customers (and us) believe it’s inevitable. Which (sadly) may make it a self-fulfilling prophecy.” Said another respondent, “it is a tricky time and has been going on two years now, uncertainty looking out has been very hard to make budgeting plans beyond six months, all indicators seem like we are in for a slowdown, it may finally be on us.” Others expressed a more optimistic view: “Stop listening to the news, there is no recession” and “business is solid. We’re forecasting a steady position for a least 6 months.”
Fastenal reported May daily sales growth of +5.2%, materially in line with our +5.0% estimate but still below normal seasonality. This included fastener sales -0.6% y/y which was the first month of declines since the 2020-2021 COVID recession and the 2016-2017 industrial recession prior to that. Safety sales were +6.8% and other non-fasteners grew +9.0% y/y. Looking forward, we model June daily sales +6.8% y/y which is also below days-adjusted normal seasonality given the soft FDI/FLI results. Looking at 2023 overall, we generally model weaker-than-seasonally-normal sales amid our over-arching assumption that recession hits in 2H23.
Risk Synopsis
Fastenal: Risks include economic sensitivity, pricing power, relatively high valuation, secular gross margin pressures, success of vending and on-site initiatives, and ability to sustain historical growth.
Industrial Distribution: Risks include economic sensitivity, pricing power, online pressure/competitive threats, global sourcing, and exposure to durable goods manufacturing.
For the full FDI report for May 2023, with graphs and disclosures, Click-here.