Written by R.W. Baird analyst David J. Manthey, CFA with Quinn Fredrickson, CFA 5/6/22
Key Takeaway:
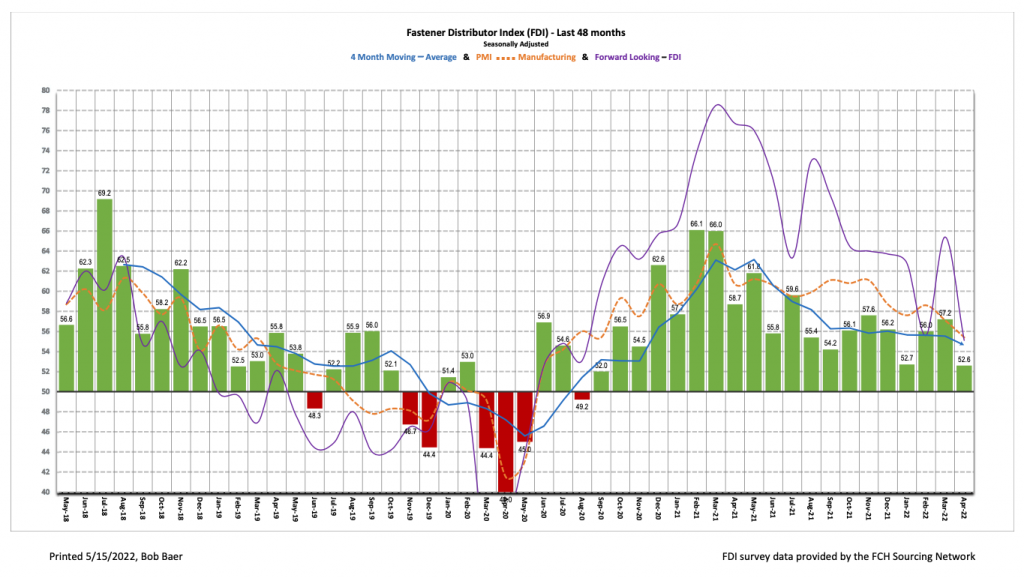
The April seasonally adjusted Fastener Distributor Index (FDI) dipped to 52.6, lower m/m, primarily on softer selling conditions. The overwhelming theme among participants commentary and across the various components of the FDI was growth but slowing growth amid material shortages, spring break, and reduced “panic buying.” Pricing continues to be on the rise, particularly in stainless steel in the wake of Russia/Ukraine. The Forward-Looking Indicator (FLI) also declined m/m to 55.1 on a less optimistic six- month outlook. Net, we believe growth and overall market conditions were still strong in April but clearly moderated relative to March.
About the Fastener Distributor Index (FDI). The FDI is a monthly survey of North American fastener distributors, conducted with the FCH Sourcing Network and Baird. It offers insights into current fastener industry trends/outlooks. Similarly, the Forward-Looking Indicator (FLI) is based on a weighted average of four forward-looking inputs from the FDI survey. This indicator is designed to provide directional perspective on future expectations for fastener market conditions. As diffusion indexes, values above 50.0 signal strength, while readings below 50.0 signal weakness. Over time, results should be directly relevant to Fastenal (FAST) and broadly relevant to other industrial distributors such as W.W. Grainger (GWW) and MSC Industrial (MSM).
Key Points:
FDI dips lower in April. The seasonally adjusted April FDI (52.6) saw growth but at a moderating rate (March 57.2). This was primarily driven by a decline in the sales index, with participant commentary attributing this to a general market slowdown, limited material availability for specialty fasteners, lower “panic buying,” and Spring break related softness. Pricing continues to march higher – particularly on stainless steel – as evidenced by further improvement in the year-to-year pricing index. Overall, growth/market conditions remain nicely positive but slowing relative to recent months.
FLI also moves lower. The seasonally adjusted FLI came in at 55.1, decreasing from last month’s 65.4 but still signaling growth ahead. Relative to March, a weaker employment reading and lower six-month outlook were the main drags. Regarding the outlook, respondents this month were evenly divided between those expecting higher activity levels (41%) and those expecting similar activity (41%) over the next six months vs. today, but the portion of participants expecting lower activity ticked up from just 9% last month to 19% in April. Overall, with demand still in a healthy place and supply chain challenges leading to very extended backlogs, we believe the FDI should remain in growth mode ahead.
FDI employment index lower m/m. The FDI employment index came in at 53.1 vs. 62.1 last month. March seemingly had participants feeling more optimistic about employment levels with a recent pickup in the pace of hiring for respondents, but April saw a return to more normalized staffing levels/hiring which put some downward pressure on the index m/m. The broader economy in April saw +428,000 job additions compared to economists’ expectation for +400,000. The US is now nearing a full recovery vs. the pre-pandemic number of jobs (just 1.2 million shy). That said, most businesses continue to report a shortage of workers, with open positions at all-time highs.
Slowing growth the overwhelming theme this month. The most common theme across all participants this month was slowing growth. One respondent said they were “seeing some market slowing, however other parts of our business are still growing.” Another respondent said, “Business is starting to taper, panic buying is over and product is [slowly] arriving. However, [there are] many concerns over the upcoming Longshoremen workers contracts discussions.” One participant attributed this slowness to vacation/spring break: “Although we were above goal this month, we had a two-week slowdown coinciding with spring break…material for specialty fasteners continues to be the biggest factor limiting our revenue growth…even with that being said our revenue is over 30% higher YOY.” Availability of products and extended lead times continues to plague respondents: “Incoming orders continue to be very strong. Material pricing still on the rise, especially stainless steel but at least we are getting regular deliveries again. Lead times on new orders are stretching out to 4-6 months depending on material.” Despite the supply chain challenges, however, for many participants sales are still tracking nicely above expectations: “Sales still performing well above historical levels despite the supply chain challenges.”
Fastenal’s +20.3% overall April daily sales growth was a touch below our +22.2% estimate and normal seasonality. Fastener sales were very strong at +25.5% y/y (essentially consistent with last month’s +25.2% growth), while safety was +16.7% and other non-fasteners were +17.8%. Looking ahead to May daily sales, we model overall daily sales +16.6% y/y. This is slightly better than normal seasonality following a slightly softer-than-seasonally-typical March and April. FAST will report May daily sales on June 6.
Risk Synopsis:
Fastenal: Risks include economic sensitivity, pricing power, relatively high valuation, secular gross margin pressures, success of vending and on-site initiatives, and ability to sustain historical growth.
Industrial Distribution: Risks include economic sensitivity, pricing power, online pressure/competitive threats, global sourcing, and exposure to durable goods manufacturing.
For the full FDI report for April 2022, with graphs and disclosures, Click-here.