Fastener Distributor Index – Report #166 October 2025
Written by R.W. Baird analyst David J. Manthey, CFA with Quinn Fredrickson, CFA 11/6/25
Key Takeaway:
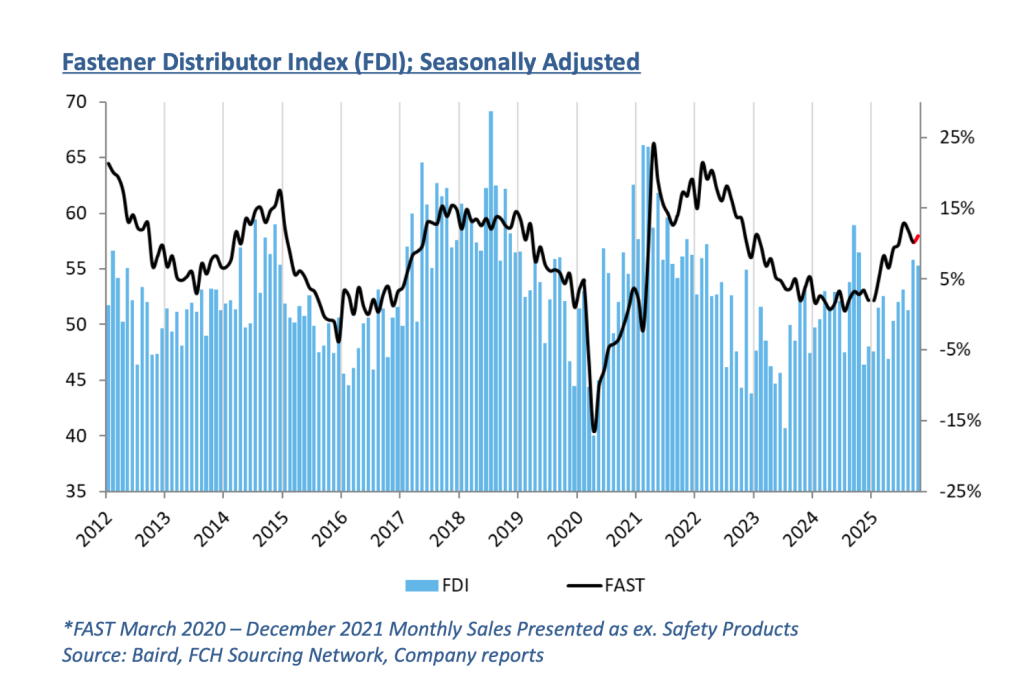
Coming off a 2025 high, the seasonally adjusted Fastener Distributor Index (FDI) was slightly lower m/m but mostly stable at 55.3 (September 55.8). On a seasonally adjusted basis, the selling index was softer m/m, while all other components of the FDI (employment, supplier deliveries, and customer inventories) improved. The Forward-Looking Indicator (FLI) was mildly higher at 51.7 due to stronger employment and a better six-month outlook. Respondent commentary pointed to continued significant pricing (not volume) growth and new business wins powering solid October results, with some cautious optimism finishing out the year and into 2026.
About the Fastener Distributor Index (FDI). The FDI is a monthly survey of North American fastener distributors, conducted with the FCH Sourcing Network and R. W. Baird. It offers insights into current fastener industry trends/outlooks. Similarly, the Forward-Looking Indicator (FLI) is based on a weighted average of four forward- looking inputs from the FDI survey. This indicator is designed to provide directional perspective on future expectations for fastener market conditions. As diffusion indexes, values above 50.0 signal strength, while readings below 50.0 signal weakness. Over time, results should be directly relevant to Fastenal (FAST) and broadly relevant to other industrial distributors such as W.W. Grainger (GWW) and MSC Industrial (MSM). Additional background information is available at:FastenersClearingHouse.com.
FDI mostly stable with a strong September. This month, the index was very mildly lower off a year-to-date September high, coming in at 55.3 vs. 55.8 last month. Seasonally adjusted sales trends were somewhat softer but still healthy overall, with the index at a robust 62.4 (September was 70.4). Half of respondents said sales were above seasonal norms, which is above average levels over the past year (38%). Of course, price increases continue to play a large role in the monthly sales performance, as pricing increased m/m for 56% of participants and 81% y/y. The percentage of respondents seeing higher pricing m/m continued to stabilize overall relative to 61% in August, 65% in July, and 66% in June – perhaps signaling tariff-related increases are starting to moderate m/m after a flurry earlier this year. Employment levels reversed to a slight m/m tailwind on the index following two consecutive weaker months, as the share of participants saying employment was “lower than seasonal norms” decreased to just 3% from 16% last month, though the overwhelming majority (84%) say employment levels are in line. Supplier lead times were relatively unchanged m/m and again had minimal impact on the index.
FLI sees some improvement and could imply near-term acceleration; PMI more mixed, however. The Forward-Looking Indicator (FLI) improved to 51.7 from 48.9 in September. This primarily reflected higher employment and a more optimistic six-month outlook. Regarding the outlook specifically, 44% now forecast better trends six months from now compared to today, increasing from 29% in September and just above the 43% average throughout 2024. Conversely, 22% forecast lower activity levels six months from now, which decreased from 39% last month. The remaining 34% anticipate stable momentum (vs. 32% last month). The October ISM PMI, meanwhile, suggested slightly worsening momentum in the industrial economy, with October coming in at 48.7 vs. September 49.1.
Pricing continues to power revenue growth, while volume is more muted; outlook leans positive.
Participants indicate that better-than-expected October revenue trends largely reflected price increases, not volume: “Tariffs reason for drastic increases.” Similarly, another said, “Sales revenue is up but volume is down. The increase in revenue is based on increased costs/tariffs.” Others are benefitting from new business wins, perhaps driven by access to made-in-the-USA products: “Continue to increase sales through new business on-boarding”; “USA made parts will continue to be favored by buyers when possible.” In terms of the outlook, tariffs and upcoming Holiday-related slowing are wild cards: “It’s crazy. Tariff uncertainty remains a big problem. It’s all through the supply chain, and the public doesn’t realize how insidious it is. Plus, from Thanksgiving on, things slow down naturally until after the first of the year.” Similarly, another respondant said, “Tariffs are still affecting business levels as companies are delaying orders in hopes to avoid tariffs. European customers are ordering directly from Europe to avoid tariffs.” Others lean more optimistic on the outlook: “Our incoming order rate continued to be strong in October. I’m sure November and December will be down slightly due to holiday schedules, but we are hoping for a strong Q1 and 2026.” Other headwinds include the government shutdown (“Despite the government shutdown and other negative indicators in the news, our business continue to grow to our surprise.”) and the depreciation of the US dollar (“Cost of goods majority is up due to tariffs but also some from the depreciating dollar. Hard to predict activity level with so much chaos regarding trade policy.”)
Fastenal reported September daily sales +10.2% y/y, which matched our estimate but also came in slightly below what normal seasonality would have implied. Consistent with last month’s strong m/m improvement in the FDI, fastener sales accelerated to 15.1% growth (from +13.3% in August). Elsewhere, safety sales were +7.2% and other non-fasteners grew +8.6% y/y. For October, we are modeling a further improvement to +11.1% y/y daily sales growth, which reflects slightly below normal seasonality due to the FDI/ISM m/m moderation but offset by further pricing lift from tariffs. October will be reported on Thursday November 6.
Risk Synopsis
Fastenal: Risks include economic sensitivity, pricing power, relatively high valuation, secular gross margin pressures, success of vending and on-site initiatives, and ability to sustain historical growth.
Grainger: Risks include ability to maintain margins, internet-only industrial supply sources, ability to sustain secular growth, cyclicality, and international operations.
MSC Industrial: Risks include cyclicality, maintaining and managing growth, success of Mission Critical initiative, and poor investor sentiment. Industrial Distribution: Risks include economic sensitivity, pricing power, online pressure/competitive threats, global sourcing, and exposure to durable goods manufacturing.
Appendix – Important Disclosures and Analyst Certification
Covered Companies Mentioned
All stock prices below are as of 11/4/2025.
Fastenal Company (FAST-$41.30-Outperform)
W.W. Grainger Inc. (GWW-$955.87-Outperform)
MSC Industrial Direct Co. Inc (MSM-$86.42-Neutral)
For the full FDI report for October 2025, with graphs and disclosures, Click-here.