Written by R.W. Baird analyst David J. Manthey, CFA with Quinn Fredrickson, CFA 10/5/23
Key Takeaway:
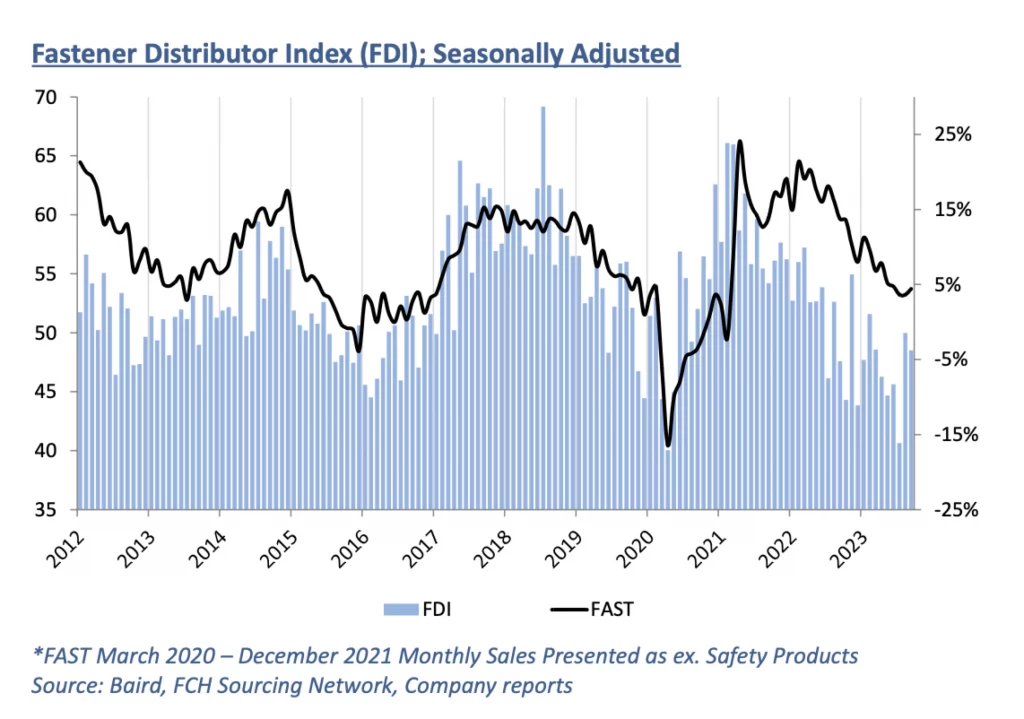
The seasonally adjusted Fastener Distributor Index (FDI) modestly retreated in September to a sub-50 reading at 48.5 after briefly reaching a neutral 50.0 in August. While August may have temporarily benefited from some pent-up demand following summer vacations, September returned to the more sluggish pace of activity seen throughout most of 2023. The Forward-Looking Indicator (FLI) was also a tick lower m/m at 44.8 compared to 45.9 last month. Overall, results suggested continued softness driven by slowing customer orders and a hesitancy among customers to stock heavily.
About the Fastener Distributor Index (FDI). The FDI is a monthly survey of North American fastener distributors, conducted with the FCH Sourcing Network and R. W. Baird. It offers insights into current fastener industry trends/outlooks. Similarly, the Forward-Looking Indicator (FLI) is based on a weighted average of four forward- looking inputs from the FDI survey. This indicator is designed to provide directional perspective on future expectations for fastener market conditions. As diffusion indexes, values above 50.0 signal strength, while readings below 50.0 signal weakness. Over time, results should be directly relevant to Fastenal (FAST) and broadly relevant to other industrial distributors such as W.W. Grainger (GWW) and MSC Industrial (MSM). Additional background is available at:FastenersClearingHouse.com.
Key Points:
FDI back below 50. After seeing substantial improvement and a return to a neutral 50 reading in August, the seasonally adjusted September FDI (48.5) softened a bit m/m and returned to contractionary territory. Looking at the overall components of the FDI, three of the four (sales, employment, and supplier deliveries) weakened m/m, while only customer inventories improved. Respondents report a hesitation from many customers to stock products at appropriate levels: “Customers still refuse to stock anything and then get mad when we don’t have enough to fill their orders completely. Nobody wants to place a blanket order or even a stock and release. Too much caution on their part and yet it ends up being our fault.” Slowing orders in customers’ books of business and extended supplier lead times were also said to be drivers of weakness. This drove the seasonally adjusted sales index to deteriorate to 44.9 from last month’s 48.8. A mere 16% of respondents indicated sales were above seasonal expectations compared to 37% last month. An equal number of respondents said sales were in line with expectations or below expectations (both 42%).
FLI remains below 50 and slightly weaker vs. August. The FLI also saw a slight deceleration, coming in at 44.8 vs. 45.9 last month. With the index remaining well below 50 and decelerating further vs. last month, additional softening could be expected in the near term. A softer employment reading and heavier respondent and customer inventory levels were the primary drags this month, while the six- month outlook was relatively unchanged. On the outlook specifically, 29% of respondents predicted higher activity levels six months from now vs. today compared to 23% last month. The percentage anticipating similar activity was slightly lower at 45% compared to 57%, while the percentage expecting softer activity increased to 26% from 20%. Altogether, the six-month outlook was essentially unchanged m/m at 51.6 vs. 51.4.
Mixed signals reign. Conflicting broader economic signals have respondents uncertain but still somewhat cautious on balance: “The economic outlook from industry resources are conflicting, but [we] see business normalizing at a level far less than [the] past couple of years but above pre-pandemic levels.” Customers remain hesitant as well given declining order patterns in their books of business: “I’ve been in close contact with my top 10 customers. A majority of them are slow in getting orders right now. They cannot pin-point it exactly but….just my thought [is] everyone is a little concerned about next year’s election and is playing everything pretty close to the vest.” Said another participant, “Continued mixed signals overall. Some customers continue to have strong demand while others are on the sidelines waiting for their customers to get busy again.” Supply chain and labor constraints remain persistent challenges: “Master distributor deliveries are pretty good (Stelfast, BBI, XL, Star etc.). USA Manufactured parts are somewhat concerning….we are getting quotes of eight weeks from the factories, we quote 9-10 weeks (add a little padding) for our customers…..but that delivery turns in to 12-16 weeks. I think that has something to do with getting qualified labor for the people actually doing the cold and hot heading of bolts.” However, not all respondents are forecasting doom and gloom, as some still have optimism: “Sales are good. Profits are steady. Expectations are good [until the] end of year.”
Fastenal reported August daily sales growth of +3.6%, just slightly below our +4.0% estimate and consensus expectations of +5.0%. This included fastener sales -3.8% y/y, which reflected further m/m deceleration and marked the fourth consecutive month of y/y declines. Safety sales were +9.5% and other non-fasteners grew +6.9% y/y. Looking forward, we model September daily sales +4.4% y/y which is also slightly below days-adjusted normal seasonality. This outlook is consistent with a string of sub-50 readings in the ISM and the sub-50 FLI. Beyond the near term, we assume 2024 returns to just modestly above normal seasonality in year one of an industrial recovery. Fastenal will report September daily sales in conjunction with 3Q23 earnings on October 12th.
Risk Synopsis
Fastenal: Risks include economic sensitivity, pricing power, relatively high valuation, secular gross margin pressures, success of vending and on-site initiatives, and ability to sustain historical growth.
Industrial Distribution: Risks include economic sensitivity, pricing power, online pressure/competitive threats, global sourcing, and exposure to durable goods manufacturing.
For the full FDI report for September 2023, with graphs and disclosures, Click-here.