Written by R.W. Baird analyst David J. Manthey, CFA 6/4/20
Key Takeaway:
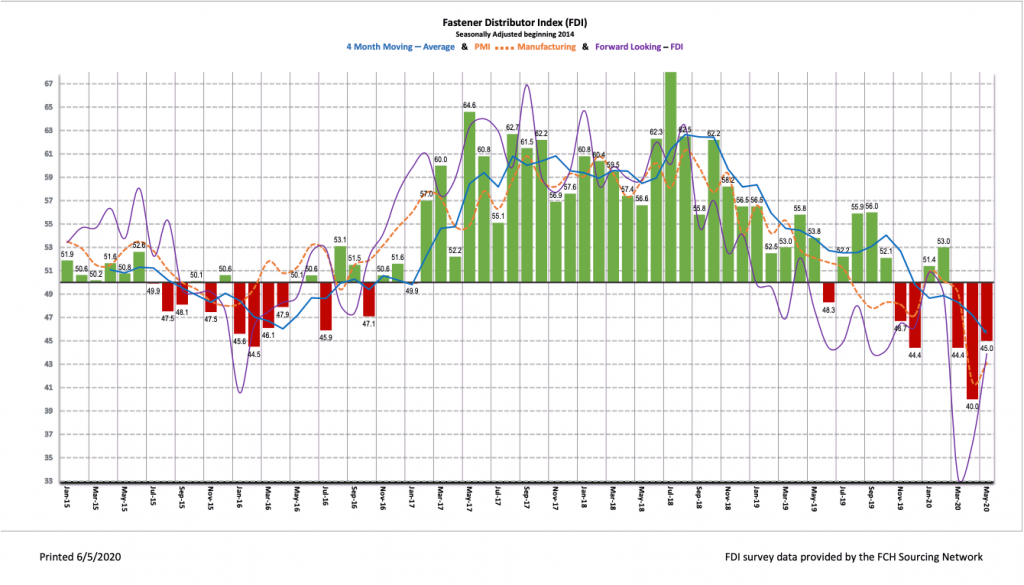
The seasonally adjusted Fastener Distributor Index (FDI) for May was 45.0, showing signs of recovery as states began reopening and some manufacturing/construction customers resumed operations. Sales trends on a seasonally adjusted basis improved m/m, albeit off a very low base. The six-month outlook also improved to a more normalized level. Net, conditions remain very weak but are showing signs of improving, potentially signaling April was the bottoming in activity level for most participants.
About the Fastener Distributor Index (FDI). The FDI is a monthly survey of North American fastener distributors, conducted with the FCH Sourcing Network and Baird with support from the National Fastener Distributors Association. It offers insights into current fastener industry trends/outlooks. Similarly, the Forward-Looking Indicator (FLI) is based on a weighted average of four forward-looking inputs from the FDI survey. This indicator is designed to provide directional perspective on future expectations for fastener market conditions. As diffusion indexes, values above 50.0 signal strength, while readings below 50.0 signal weakness. Over time, results should be directly relevant to Fastenal (FAST) and broadly relevant to other industrial distributors such as W.W. Grainger (GWW) and MSC Industrial (MSM).
Key Points:
FDI recovers in May. The seasonally adjusted May FDI (45.0) improved vs. April, consistent with an improvement in last month’s forward-looking indicator and the May ISM PMI. Several participants commented that business activity seems to have leveled off or improved since April, implying a majority of respondents have perhaps already seen the bottom. Consistent with this, the seasonally adjusted sales index also showed improvement, albeit remaining at a very low level (28.9 vs. 14.0 last month). Pricing remained stable for most respondents.
FLI continues to improve. The seasonally adjusted FLI increased to 43.9, a sharp uptick from last month’s 36.2. Respondents are on balance once again feeling more optimistic than pessimistic about the six- month outlook, while employment has also started to return to more normal levels. These two factors primarily accounted for the m/m improvement in the FLI. Net, with the FLI improving for two straight months and the US economy beginning to reopen, we believe the FDI could see steady improvement in the immediate term.
Hiring sentiment is improving. The FDI employment index registered a 40.0 reading, a significant improvement from the last two months (~27.0). Several respondents characterized employment levels as above seasonal expectations, a departure from the last couple months which had none. Similarly, the percentage of respondents noting lower employment levels than seasonally normally decreased to 28% vs. 46% the last two months. Looking at the broader economy, while the employment picture continues to look bleak with over 40 million US workers having filed claims for unemployment benefits since the crisis started, the rate of new claims has started to moderate over the past couple weeks, an encouraging development.
Respondent commentary shows trends may be turning the corner. After bleak commentary last month, several respondents noted that demand trends seem to have at least stabilized, if not improved in May. One respondent commented, “Business activity seems to be improving already. Sales in May were not great, but definitely better. It seems like we are off the bottom and moving in the right direction.” Another commented, “Regarding revenue, April was down 11.25% month/month and our May figures flattened with the exact sales as April so at least the bleeding has stopped.” This optimism that activity has bottomed was also prevalent in the six-month outlook where 43% of respondents now expect higher activity levels six months from now vs. today compared to an average of just 25% in March/April. Additionally, only 28% now expect lower activity levels vs. today compared to 54% last month.
Supplemental questions. This month respondents were asked three supplemental questions pertaining to the shape of a recovery, changes to operations post COVID-19, and expectations for headcount going forward. With regard to the shape of the recovery in business activity, zero respondents anticipate a “V- shaped recovery” (bouncing right back). Responses were fairly evenly split between a “U” (staying down a while longer, then it will rebound) and a “W” (the balance of 2020 will be very choppy). Lastly, only 8% of respondents anticipate an “L” (there won’t be a bounce back on in 2020). Turning to operational changes post-virus crisis, the vast majority of respondents (74%) expect only minor changes to the way they operate their business after re-opening; conversely, only 8% expect significant changes and 18% expect no significant changes. Lastly, most respondents expect employee headcount over the rest of the year to either modestly decline (34%) or stay the same (50%); only 3% expect headcount to sharply decline, while 13% plan to expand headcount.
Fastenal reported a very impressive +14.8% overall May daily sales growth vs. our -6.2% estimate, again boosted by a huge surge in demand for safety products (+136% y/y). Excluding safety products, underlying sales were -10.0% y/y, showing improvement vs. April’s -16.4% y/y (similar to the FDI). Fastener sales, while lagging growth in other non-safety products, also showed m/m improvement at – 15.3% y/y compared to -22.5% in April. Looking forward, June safety product sales will likely continue to benefit from surge orders, although we assume not to the same degree as April/May, while we expect momentum in fastener products and other non-fastener products to continue to improve as the economy further reopens. As such, we model overall +0.7% daily sales in June.
Risk Synopsis
Fastenal: Risks include economic sensitivity, pricing power, relatively high valuation, secular gross margin pressures, success of vending and on-site initiatives, and ability to sustain historical growth.
Industrial Distribution: Risks include economic sensitivity, pricing power, online pressure/competitive threats, global sourcing, and exposure to durable goods manufacturing.
For the full FDI report for May 2020, with graphs and disclosures, Click-here.