Written by R.W. Baird analyst David J. Manthey, CFA with Quinn Fredrickson, CFA 4/3/24
Key Takeaway:
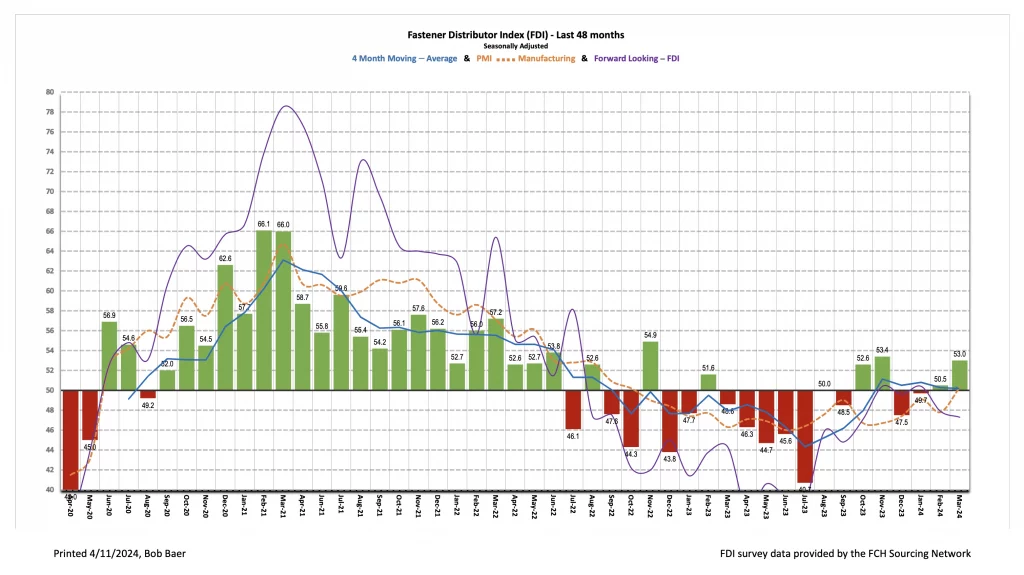
The seasonally adjusted Fastener Distributor Index (FDI) expanded further in March, increasing to 53.0, up from 50.5 in February. Demand commentary leaned overall fairly positive but balanced out by a noticeable uptick in comments regarding continued rises in freight/container costs and labor strikes/delivery issues. This month’s Forward-Looking Indicator (FLI), meanwhile, was stable, albeit below 50, which implies deceleration could be ahead. Net, we believe the FDI suggests a modestly improving/growing fastener market in March. Bigger picture, the index and market conditions continue to climb out of the malaise seen throughout most of 2023, with some lingering sources of uncertainty as participants look to the remainder of 2024, election, labor strikes, port/ocean container issues, etc.
About the Fastener Distributor Index (FDI). The FDI is a monthly survey of North American fastener distributors, conducted with the FCH Sourcing Network and R. W. Baird. It offers insights into current fastener industry trends/outlooks. Similarly, the Forward-Looking Indicator (FLI) is based on a weighted average of four forward- looking inputs from the FDI survey. This indicator is designed to provide directional perspective on future expectations for fastener market conditions. As diffusion indexes, values above 50.0 signal strength, while readings below 50.0 signal weakness. Over time, results should be directly relevant to Fastenal (FAST) and broadly relevant to other industrial distributors such as W.W. Grainger (GWW) and MSC Industrial (MSM). Additional background information is available at:FastenersClearingHouse.com.
Key Points:
FDI sees further m/m improvement. The seasonally adjusted FDI saw improvement for the third consecutive month, coming in at 53.0 (February 50.5). Improvement in the index was more broad based than in recent months as two of the four underlying indices expanded m/m (sales and employment) vs. just one last month (supplier deliveries). Looking at the sales index specifically, 40% of respondents indicated sales came in above seasonal expectations – improving vs. 31% last month and exceeding the 31% average over the past year. Another 47% said sales were in line (31% in February), while just 13% saw weaker sales than expected compared to 38% last month. The 13% below expectations marked the lowest percentage seen since March 2022 (6%).
FLI steady at below 50. The FLI continues to somewhat balance out the positivity registered in the overall FDI as the FLI remains sub 50 (47.3) – indicating contraction. However, the FLI was relatively unchanged m/m with February’s 47.9. Looking at it vs. February, a more bullish employment picture was entirely offset by a less rosy six-month outlook. On the outlook specifically, respondents were exactly split between those expecting higher activity levels six months from now vs. today (33%), similar (33%), and lower (33%). This compares to 47% of respondents predicting higher in February, 34% similar, and 19% lower. This drove the six-month outlook index to decline to a reading of 50.0 vs. 64.1 last month.
Demand commentary leaned positive but freight/supply chain negativity an offset. The key theme of demand commentary was, on balance, pleasantly surprised: “The last 12 months have been surprisingly good for us. Praying for no ‘black-swan events’ in the coming year so we can continue this trend.” Said another participant, “March continues the previous two months of this year, with strong demand for our domestic products. Surprisingly, due to the election year. Continuing to ride the wave while it lasts.” Lastly, a participant characterized it as a “good March, consistent with February incoming order rate. Hoping for a strong 2Q.” Those with a less positive view on demand see it as “a little flat” and/or with headwinds from customers “leaning out their inventories and looking for ways to free up cash.” On the negative side, there were many comments about recent increases in ocean/freight costs: “Prices for products have been steadily coming down in some areas, but out-of-control freight charges drive it back up. Everyone is wrongly blaming supply, but [it] is the carriers over charging without care…” Echoing this, another respondent said, “I don’t believe pricing is being affected by anything except shipping. The freight companies and ocean freight companies use any excuse to raise rates. It’s adversely affecting stable pricing.” Lastly, labor strife is apparently having a negative impact as well: “Labor strike in Germany causing delivery issues.”
Fastenal will report March daily sales on April 11th in conjunction with 1Q24 earnings. The company earlier reported February daily sales growth of +2.6% y/y which was better than our +1.4% estimate and slightly above what normal seasonality would imply. We believe this was likely partly due to a catchup from weather headwinds, which management had estimated as a 1.2-1.5% drag on January daily sales growth. Fastener sales, specifically, were -3.5% y/y in February, accelerating from January’s -6.0% decline but still marking the tenth consecutive month of either flat or declining y/y sales for this product line. Elsewhere, safety sales were +8.3% and other non-fasteners grew +4.8% y/y. For March, we are modeling +5.1% y/y daily sales growth which would be slightly below normal m/m growth due to Good Friday/Easter falling in March this year. Absent the impact of this, we assume daily sales growth relatively in line with seasonal norms given the positivity in the headline FDI, partially offset by a still sub-50 FLI. For 2024 overall, we assume FAST’s growth will return to just modestly above normal seasonality in year one of an industrial recovery which we assume primarily begins in 2H24; in contrast, most of 2023 was below seasonally normal sales.
Risk Synopsis
Fastenal: Risks include economic sensitivity, pricing power, relatively high valuation, secular gross margin pressures, success of vending and on-site initiatives, and ability to sustain historical growth.
Grainger: Risks include ability to maintain margins, internet-only industrial supply sources, ability to sustain secular growth, cyclicality, and international operations.
MSC Industrial: Risks include cyclicality, maintaining and managing growth, success of Mission Critical initiative, and dual classes of stock.
Industrial Distribution: Risks include economic sensitivity, pricing power, online pressure/competitive threats, global sourcing, and exposure to durable goods manufacturing.
For the full FDI report for January 2024, with graphs and disclosures, Click-here.