Written by R.W. Baird analyst David J. Manthey, CFA with Quinn Fredrickson, CFA 7/12/23
Key Takeaway:
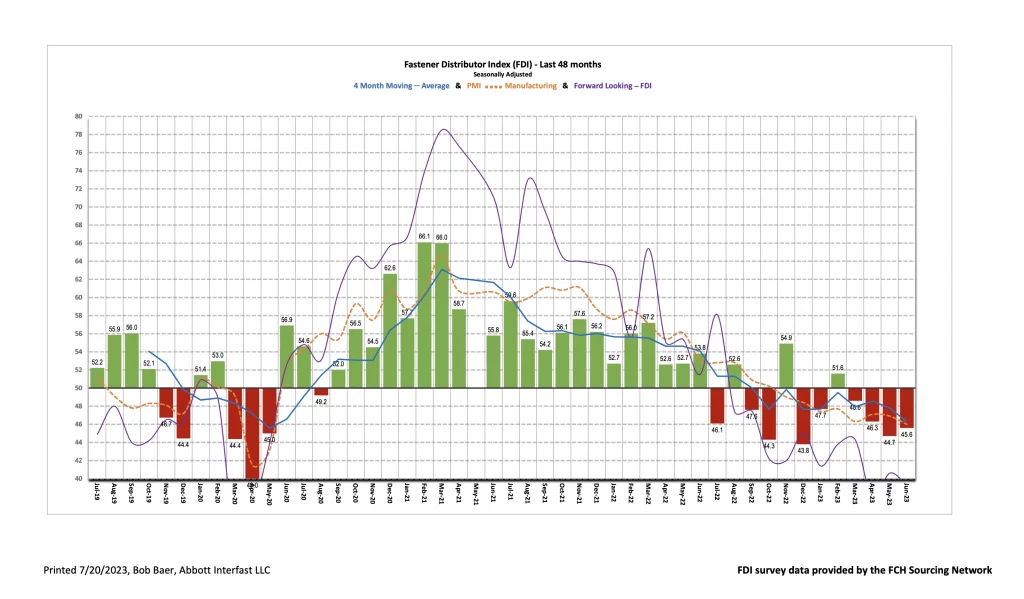
The seasonally adjusted Fastener Distributor Index (FDI) rebounded slightly to 45.6 compared to 44.7 in May. Respondents pointed to increased quoting activity as the primary driver of the m/m improvement. The Forward-Looking Indicator (FLI) regressed slightly, moving further below the neutral-50 reading to 39.3 vs. May 40.6. Overall, results were mixed, with a slight improvement in the FDI offset by further retrenchment in the FLI – suggesting conditions could get weaker ahead.
About the Fastener Distributor Index (FDI). The FDI is a monthly survey of North American fastener distributors, conducted with the FCH Sourcing Network and R. W. Baird. It offers insights into current fastener industry trends/outlooks. Similarly, the Forward-Looking Indicator (FLI) is based on a weighted average of four forward- looking inputs from the FDI survey. This indicator is designed to provide directional perspective on future expectations for fastener market conditions. As diffusion indexes, values above 50.0 signal strength, while readings below 50.0 signal weakness. Over time, results should be directly relevant to Fastenal (FAST) and broadly relevant to other industrial distributors such as W.W. Grainger (GWW) and MSC Industrial (MSM). Additional background is available at:FastenersClearingHouse.com.
Key Points:
FDI a touch stronger m/m. The seasonally adjusted June FDI (45.6) rebounded slightly vs. last month’s 44.7, ending three consecutive months of moderation. Three of the four components of the FDI (sales, supplier deliveries, and customer inventories) saw sequential improvement, while the employment index declined sharply m/m. One respondent provided commentary that “we are seeing a very high level of quote activity, and orders are increasing slightly,” which is representative of the seasonally adjusted sales index rising to 41.9 in June and ending its three-month slide since February.
FLI retrenches below 40 again. After registering improvement in May, the FLI decreased to 39.3 from May’s 40.6. The FLI remains well below 50, indicating further weakening is expected ahead. Much weaker readings in the employment index drove most of the decline, with lower respondent inventory levels partially offsetting. While a greater percentage of respondents predict higher activity six months from now at 17% vs. 11% last month, the percentage of respondents predicting lower activity also picked up (45% vs. 41% in May). While supply chain overall continues to improve, product availability remains a constraint on growth for some. One respondent noted that “too many of our vendors have dropped the ball on stocking… If you don’t stock it, you can’t expect to sell it.”
Signs of reshoring beginning to emerge. As a supplemental question to our normal survey, we asked respondents “Have you seen any signs of supply reshoring in the past few months?” Of those surveyed, 39% noted that they had seen signs of reshoring, with 21% having specific examples of business returning to the United States. Respondents are cautious not to overstate the significance of reshoring yet, though, with one respondent noting that “some US [manufacturing business] is returning, although I suspect only temporarily.” Another commented that he has “a couple of customers that were having parts made complete in China, now they are asking for several of the ‘sub-components’ to make them in the States. Only a few parts, but they are parts coming back to the USA.” Lastly, some respondents are pointing out nearshoring is occurring, rather than reshoring, with one indicating that “some of our customers are moving business from China to Mexico.” Overall, should reshoring and nearshoring continue to progress, it could serve as a tailwind for the industry.
Outlook remains soft but some hopes for stabilization emerging. The six-month outlook was mostly flat this month when compared with last month, coming in at 36.2 vs. 35.2 in May. For reference, “peak optimism” post pandemic occurred in March 2021 with the six-month index at 90.6 and 88% of participants expecting better activity levels six months ahead. While the outlook remains on balance more pessimistic regarding the next six months compared to today, survey respondents still see fairly healthy sales/activity vs. pre-pandemic. One respondent noted that “though seeing activity slower and sales normalize, our company is still operating a double-digit level above pre-pandemic numbers.” Another commented that “inflation is cooling in the majority of our business,” and that the “overall short-term outlook is looking up for our business.”
Fastenal reported May daily sales growth of +5.2%, materially in line with our +5.0% estimate but still below normal seasonality. This included fastener sales -0.6% y/y which was the first month of declines since the 2020-2021 COVID recession and the 2016-2017 industrial recession prior to that. Safety sales were +6.8% and other non-fasteners grew +9.0% y/y. Looking forward, we model June daily sales +6.8% y/y which is also below days-adjusted normal seasonality given the soft FDI/FLI results. FAST will report June daily sales in conjunction with 2Q23 earnings on July 13th. Looking at 2023 overall, we generally model weaker-than-seasonally-normal sales amid our over-arching assumption that recession hits in 2H23.
Risk Synopsis
Fastenal: Risks include economic sensitivity, pricing power, relatively high valuation, secular gross margin pressures, success of vending and on-site initiatives, and ability to sustain historical growth.
Industrial Distribution: Risks include economic sensitivity, pricing power, online pressure/competitive threats, global sourcing, and exposure to durable goods manufacturing.
For the full FDI report for June 2023, with graphs and disclosures, Click-here.