Written by R.W. Baird analyst David J. Manthey, CFA with Quinn Fredrickson, CFA 8/9/23
Key Takeaway:
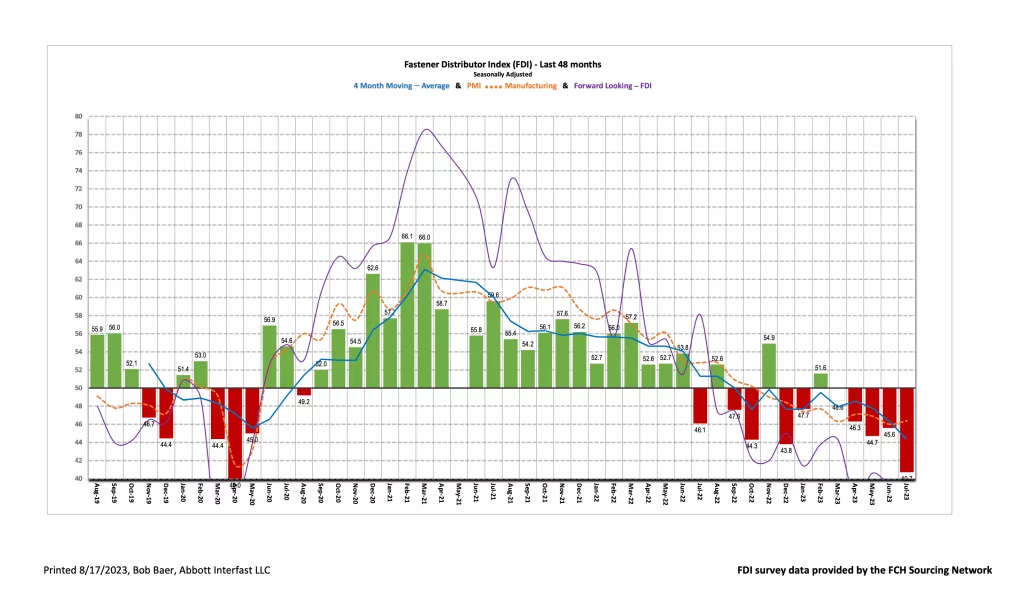
The seasonally adjusted Fastener Distributor Index (FDI) retreated to 40.7 compared to 45.6 in June. Respondents pointed to potential vacation/holiday noise and soft new orders (despite healthy quoting). The Forward-Looking Indicator (FLI) also regressed but very modestly off an already low base, coming in at 38.8 vs. June 39.3. Overall, results suggested a soft month for fastener market conditions in July, and while early month holiday noise likely played a role, demand nonetheless remains fairly soft.
About the Fastener Distributor Index (FDI). The FDI is a monthly survey of North American fastener distributors, conducted with the FCH Sourcing Network and R. W. Baird. It offers insights into current fastener industry trends/outlooks. Similarly, the Forward-Looking Indicator (FLI) is based on a weighted average of four forward- looking inputs from the FDI survey. This indicator is designed to provide directional perspective on future expectations for fastener market conditions. As diffusion indexes, values above 50.0 signal strength, while readings below 50.0 signal weakness. Over time, results should be directly relevant to Fastenal (FAST) and broadly relevant to other industrial distributors such as W.W. Grainger (GWW) and MSC Industrial (MSM). Additional background is available at:FastenersClearingHouse.com.
Key Points:
FDI softens significantly vs. last month. The seasonally adjusted July FDI (40.7) was substantially lower vs. last month’s 45.6, dragged down by a significantly weaker than expected sales backdrop. Three of the four components of the FDI (sales, employment, and supplier deliveries) saw sequential deterioration, while customer inventories showed some m/m improvement. Quoting activity was said to be high but conversion to actual orders was lacking: “Quoting activity is high, however orders are not matching. Customers are not picking up as much as we expected in July.” This drove the seasonally adjusted sales index to record a reading of just 22.3, down sharply from 41.9 last month. 70% of respondents indicated sales were below seasonal expectations, which is the highest since the early days of the pandemic (April 2020 83%). Sales exceeded expectations for only 10% of respondents. We suspect vacations and/or Fourth of July holiday timing (on a Tuesday) played a role; some respondents suspect so as well: “July bookings really dropped, shipments of previous orders are still going out the door, but new orders [were soft]. Could be vacation time popular in July, or a combination of slowing business and vacation.” Said another participant, “Believe July sales were lower due to the holiday, overall YTD results are strong.”
FLI remains below 40. The FLI was also slightly softer m/m, decreasing to 38.8 from June’s 39.3. The FLI remains well below 50, indicating further weakening is expected ahead. Softer employment and higher respondent/customer inventories more than offset a slightly improved six-month outlook. On the outlook specifically, a slightly higher percentage of respondents predicted higher activity levels six months from now vs. today compared to last month (23% in June, 17% in May). The percentage anticipating similar activity was relatively unchanged (40% vs. 38% last month), but fewer people now expect lower activity levels (37% vs. 45% in June).
Signs of improvement emerging for some respondents; others see stabilization. While the outlook remains on balance more pessimistic regarding the next six months compared to today, some participants are striking a more optimistic tone: “The recent increase in activity from June through July indicates a possible robust end to 2023 based on historic trends. The indication shows promise.” Others see more stabilization (ex. the residential market) than acceleration or deceleration: “Residential related end users are slow to consume high-cost basis inventory, delaying market price adjustments to account for lower material/freight costs. Inventory levels are high for anything residential related, but all other sectors appear to be stable.” With quoting activity still said to be high and the FDI sales index marking a post-pandemic all-time low, perhaps we are closer to approaching a bottom for the FDI index/overall activity levels.
Fastenal reported July daily sales growth of +3.7%, exceeding our +2.3% estimate and slightly better than normal seasonality. This included fastener sales -1.9% y/y, however, which reflected further m/m deceleration and marked the third consecutive month of y/y declines. Safety sales were +8.3% and other non-fasteners grew +6.6% y/y. Looking forward, we model August daily sales +4.0% y/y which is also in line with days-adjusted normal seasonality. Based on slightly below normal sequential growth thereafter, we have y/y ADS growth rates dropping to the low-single digits for FAST by 4Q23. This outlook is consistent with a string of sub-50 readings in the ISM and the Baird FDI survey of private fastener distributors.
Risk Synopsis
Fastenal: Risks include economic sensitivity, pricing power, relatively high valuation, secular gross margin pressures, success of vending and on-site initiatives, and ability to sustain historical growth.
Industrial Distribution: Risks include economic sensitivity, pricing power, online pressure/competitive threats, global sourcing, and exposure to durable goods manufacturing.
For the full FDI report for July 2023, with graphs and disclosures, Click-here.