Written by R.W. Baird analyst David J. Manthey, CFA 8/5/20
Key Takeaway:
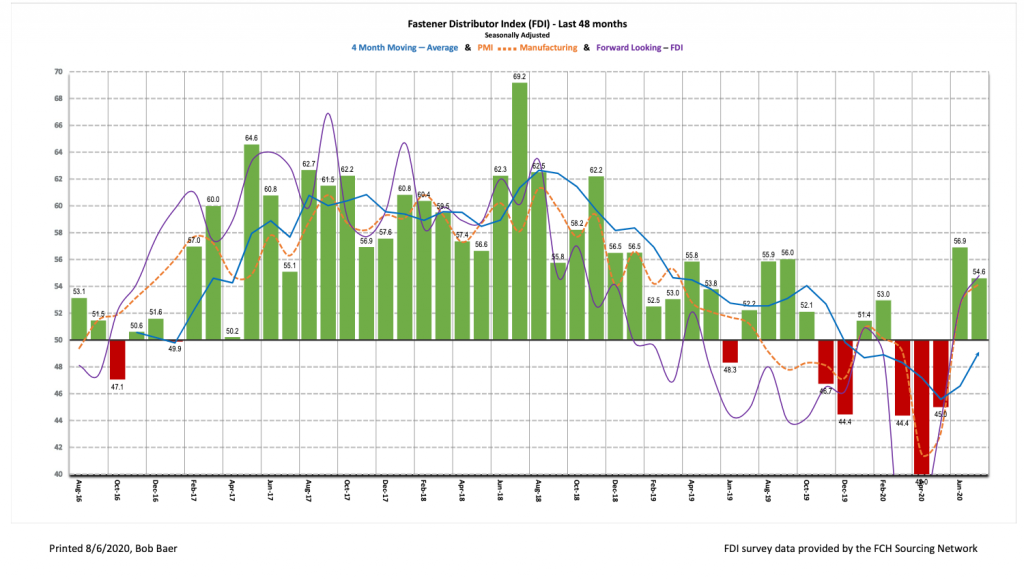
The seasonally adjusted Fastener Distributor Index (FDI) for July was 54.6, consistent with improving momentum (above 50 reading) but at a slower rate vs. the improvement seen in June (FDI decreased m/ m). As a diffusion index, the 54.6 reading indicates the trajectory of sales trends is improving m/m, but activity levels are likely not yet near pre-COVID levels (i.e., market conditions were much stronger in February 2020 despite a 53.0 FDI vs. a 54.6 this month, but trends are increasing at a faster m/m rate now than in February 2020). Looking at the drivers of the m/m moderation in the FDI, sales trends continued to improve, but the employment index slightly decreased, dragging down the overall index. The six-month outlook also improved vs. June as participants continue to gain confidence in a recovery taking shape. Net, July showed further m/m recovery, albeit with the pace of improvement moderating relative to the strong improvements seen in May/June.
About the Fastener Distributor Index (FDI). The FDI is a monthly survey of North American fastener distributors conducted by the FCH Sourcing Network and Baird, with support from the National Fastener Distributors Association. It offers insights into current fastener industry trends/outlooks. Similarly, the Forward-Looking Indicator (FLI) is based on a weighted average of four forward-looking inputs from the FDI survey. This indicator is designed to provide directional perspective on future expectations for fastener market conditions. As diffusion indexes, values above 50.0 signal strength, while readings below 50.0 signal weakness. Over time, results should be directly relevant to Fastenal (FAST) and broadly relevant to other industrial distributors such as W.W. Grainger (GWW) and MSC Industrial (MSM).
Key Points:
July FDI is consistent with continued improvement but at slower rate. The seasonally adjusted July FDI (54.6) moderated from June (56.9) but was still consistent with m/m improvement (FDI above 50). The seasonally adjusted sales index, specifically, showed additional strong m/m improvement, reaching 79.2 this month vs. 69.9 in June. Pricing remained stable for most respondents.
FLI continues to improve. The seasonally adjusted FLI increased to 54.8, showing the fourth straight month of m/m improvement. Respondents continue to feel more optimistic than pessimistic about the six-month outlook on balance, while decreasing customer inventory levels possibly signal a need for customers to re-stock in the future, a positive sign for future activity levels. These two factors primarily accounted for the m/m improvement in the FLI. Net, we believe the FDI should see continued above-50 readings, with August specifically likely to see a m/m increase given the improvement registered in the July reading.
Hiring sentiment cooled. The FDI employment index registered a 44.3 reading, a step down from last month’s 56.6. After an elevated month of hiring in June (presumably as additional customer facilities opened and lingering state/local government restrictions were eased), July was a more stable month for hiring. Additionally, a slight uptick in the percentage of respondents noting lower than seasonally normal employment levels was registered (20%), albeit nowhere near March/April (46%). Looking at the broader economy, while the unemployment rate remains elevated (11.1% as of June), both May and June saw much better-than-expected job gains as businesses re-opened. Should additional COVID-related business closures or government mandated shutdowns occur, we could see the employment situation quickly deteriorate again, but recent gains have been undoubtedly positive news for the US economy. The July jobs report is expected on Friday (8/7) and average expectations are for a net addition of 1.3 million jobs, though there’s a notably wide range of estimates, with some economists projecting a net loss of 400,000.
Respondent commentary mixed. Some respondents see activity continuing to improve through July and looking ahead over the remainder of 2020. Per one respondent, “[I] expect activity to increase unless there is a setback with the economy relating to the virus.” Another commented, “Sales in July were surprisingly higher than expected and higher than June. That said, we continue to expect the line to flatten and a decrease in sales for Q3-Q4 compared to last year.” Others remain more guarded in their expectations, noting “Automotive related still very slow,” and “Venders in US and abroad are way slower.” Attitudes about expected activity levels over the next six months compared to today are undoubtedly much more positive than negative on balance, however, with 63% of participants expecting higher activity levels and just 11% expecting lower.
Supplemental questions. In response to three supplemental questions this month, most respondents do not distribute PPE (58%) but 30% of respondents have increased PPE on a small scale amid COVID-19. On supply chain changes, most respondents have made at least a small shift to look more closely at domestic suppliers (53%). Lastly, in regards to online marketplace competition, 56% of respondents see some level of market pressure from online marketplaces while 44% do not. Data charts appear on page 4 of this report.
Fastenal reported an impressive 9.5% overall June daily sales growth vs. our +0.6% estimate, again boosted by a huge surge in demand for safety/PPE products (+95% y/y). Excluding safety products, underlying sales were -8.0% y/y, showing improvement vs. May’s -10.0% y/y (similar to the FDI) and more in line with our -7.4% estimate. Fastener sales, while lagging growth in other non-safety products, also showed m/m improvement at -11.4% y/y vs. May at -15.3%. Looking forward, July safety product sales will likely continue to benefit from surge orders, although we are conservatively assuming not to the same degree as June (July estimate is +25% vs. June +95%), while we expect momentum in fastener products and other non-fastener products to continue to improve. For context, each 10% of safety growth adds ~1.8% of growth to overall FAST ADS. As such, we are modeling overall -0.7% daily sales in July, which will be reported on Thursday (8/6).
Risk Synopsis
Fastenal: Risks include economic sensitivity, pricing power, relatively high valuation, secular gross margin pressures, success of vending and on-site initiatives, and ability to sustain historical growth.
Industrial Distribution: Risks include economic sensitivity, pricing power, online pressure/competitive threats, global sourcing, and exposure to durable goods manufacturing.
For the full FDI report for July 2020, with graphs and disclosures, Click-here.