Written by R.W. Baird analyst David J. Manthey, CFA with Quinn Fredrickson, CFA 2/7/24
Key Takeaway:
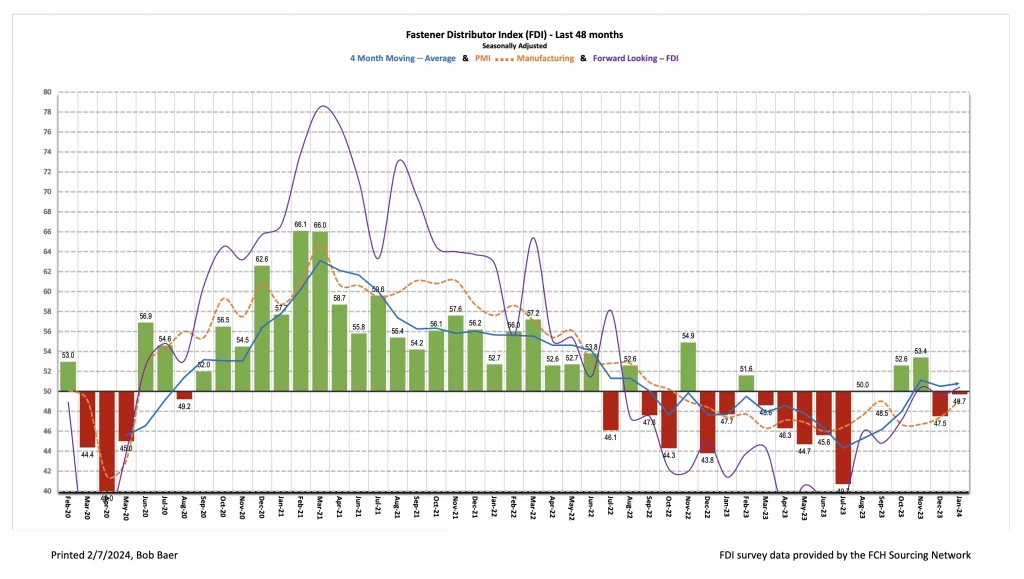
The seasonally adjusted Fastener Distributor Index (FDI) saw solid m/m improvement in February with a 49.7 reading, as most underlying components of the index rose back into expansionary territory. Comments were again somewhat mixed but overall tone leaned net positive on balance. The Forward- Looking Indicator (FLI) also improved vs. January inching up to 50.4, touching just above neutral level. Overall, we believe this month’s FDI/FLI is consistent with a market that, while still soft, shows some signs of underlying stabilization to slight improvement.
About the Fastener Distributor Index (FDI). The FDI is a monthly survey of North American fastener distributors, conducted with the FCH Sourcing Network and R. W. Baird. It offers insights into current fastener industry trends/outlooks. Similarly, the Forward-Looking Indicator (FLI) is based on a weighted average of four forward- looking inputs from the FDI survey. This indicator is designed to provide directional perspective on future expectations for fastener market conditions. As diffusion indexes, values above 50.0 signal strength, while readings below 50.0 signal weakness. Over time, results should be directly relevant to Fastenal (FAST) and broadly relevant to other industrial distributors such as W.W. Grainger (GWW) and MSC Industrial (MSM). Additional background is available at:FastenersClearingHouse.com.
Key Points:
FDI nearly reaches neutral level. After a soft December, the FDI improved m/m and nearly reached the neutral level (49.7 compared to 47.5 in December). Based on comments in last month’s report, holiday- related slowness (vacations, plant shutdowns etc.) was a significant drag on December for many participants, and the absence of such headwinds seemingly drove the sequential rebound in January. All four components of the FDI (sales, employment, supplier deliveries and customer deliveries) were sequentially flat to higher. 44% of respondents indicated sales came in above seasonal expectations which was up significantly vs. the 24% in December and also above the 31% average over the past 12 months. Another 41% said sales were in line (38% in December), while just 15% saw weaker sales than expected (December 38%).
FLI back into growth territory. Similarly, the FLI saw sequential improvement, coming in at 50.4 vs. 49.6 last month. The FLI has now been above 50 in two of the past three months, indicating expectations for a return to growth/expansion ahead. The m/m improvement in the January FLI reflected slightly lower inventory levels for respondents and a modestly higher six-month outlook. On the outlook specifically, 54% of respondents predicted higher activity six months from now vs. today compared to 55% last month. The percentage anticipating similar activity was 36% compared to 31% in December, while the percentage expecting softer activity was just 10% (last month 14%). This drove the six-month outlook index to register 71.8 vs. 70.7 last month.
On balance, a slightly more optimistic tone was present in respondent commentary. While there continues to be a healthy mix of both bulls and bears, on balance we felt commentary skewed slightly more optimistic this month. For the optimists, January was a healthy month (even if somewhat choppy): “January started very strong. Much different than a year ago which is good.” Echoing this, another participant said, “We experienced extreme highs and lows in the month of January. Overall, was a positive month, but was very hard to predict the finish. Will be interesting to see how the rest of the year will go as the election heats up .” Encouraging momentum/sentiment on the general economy was also noted: “Encouraging the GDP forecast went from 1.7% beginning of Q4-2023 to 2.2% for 2024.” More cautious commentary included those participating in the automotive market: “Automotive tier customers continue their pursuit of cost reductions. Heat treat and plating subcontractors continue to surcharge/pass along increases in energy.” OEM fasteners were also said to be weaker than MRO: “Our MRO customers are doing well, while some of our OEM’s seem to still be struggling across a wide range of markets. They are having ‘slow downs’ and [putting] some of their employees on 4 a day work week, hoping to not have to have layoffs. Some of the concerns are that if they lay them off, when and if business comes back, they won’t have the manpower to start back up. While the stock market is doing well, that is not an indication of what the market looks like on the street. Not to be doom and gloom, some markets that we sell into are doing quite well, others are struggling.”
Fastenal reported January daily sales growth of +1.6% y/y which was below our +2.6% estimate and what normal seasonality would imply. However, this was inclusive of a 1.2-1.5% headwind from weather, so absent this, we estimate sales would have been consistent with our estimate/normal seasonality. Fastener sales, specifically, were -6.0% y/y, which decelerated vs. December (-1.9%) and marked the ninth consecutive month of either flat or declining y/y sales for this product line. Elsewhere, safety sales were +9.7% and other non- fasteners grew +3.3% y/y. Looking ahead, we model +1.4% y/y daily sales growth for FAST in February which would be consistent with normal m/m growth. Given improving momentum in the ISM PMI and the FLI, we feel that normal m/m growth is achievable for FAST. For 2024 overall, we assume FAST’s growth will return to just modestly above normal seasonality in year one of an industrial recovery which we assume primarily begins in 2H24; in contrast, most of 2023 was below seasonally normal sales.
Risk Synopsis
Fastenal: Risks include economic sensitivity, pricing power, relatively high valuation, secular gross margin pressures, success of vending and on-site initiatives, and ability to sustain historical growth.
Grainger: Risks include ability to maintain margins, internet-only industrial supply sources, ability to sustain secular growth, cyclicality, and international operations.
MSC Industrial: Risks include cyclicality, maintaining and managing growth, success of Mission Critical initiative, and dual classes of stock.
Industrial Distribution: Risks include economic sensitivity, pricing power, online pressure/competitive threats, global sourcing, and exposure to durable goods manufacturing.
For the full FDI report for January 2024, with graphs and disclosures, Click-here.