Written by R.W. Baird analyst David J. Manthey, CFA with Quinn Fredrickson, CFA 3/5/24
Key Takeaway:
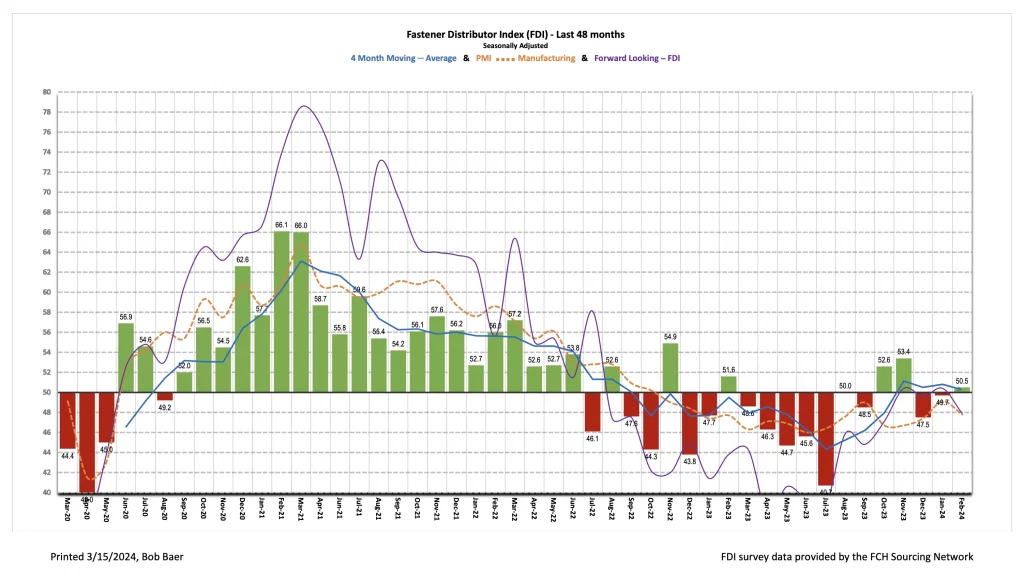
The seasonally adjusted Fastener Distributor Index (FDI) bounced back to growth (>50) in February with a reading of 50.5. A key theme present among respondent commentary was stabilization/consistency in demand. After accurately forecasting the rebound in this month’s FDI, the Forward-Looking Indicator (FLI) slightly retrenched, dipping to 47.9, implying some deceleration ahead. Overall, while the headline FDI showed some moderate m/m improvement, our key takeaway is that conditions were fairly steady in February. Notably, however, the stable to slight improvement in demand conditions seen over the past five months is a marked improvement from the decelerating environment seen by participants throughout much of 2023.
About the Fastener Distributor Index (FDI). The FDI is a monthly survey of North American fastener distributors, conducted with the FCH Sourcing Network and R. W. Baird. It offers insights into current fastener industry trends/outlooks. Similarly, the Forward-Looking Indicator (FLI) is based on a weighted average of four forward- looking inputs from the FDI survey. This indicator is designed to provide directional perspective on future expectations for fastener market conditions. As diffusion indexes, values above 50.0 signal strength, while readings below 50.0 signal weakness. Over time, results should be directly relevant to Fastenal (FAST) and broadly relevant to other industrial distributors such as W.W. Grainger (GWW) and MSC Industrial (MSM). Additional background information is available at:FastenersClearingHouse.com.
Key Points:
FDI back just slightly above 50. Following solid m/m improvement in January, the FDI saw further modest sequential improvement in February, reaching a level just above the neutral 50 reading and indicating growth (50.5). However, when looking at the underlying drivers, the FDI paints a slightly more mixed picture as three of the four components (sales, employment and customer inventories) were stable to lower m/m. Only the supplier deliveries index saw a m/m improvement, which drove the overall m/m improvement in the headline FDI. Looking at the sales index specifically, 31% of respondents indicated sales came in above seasonal expectations which was down vs. 44% in January but essentially matched the 30% average over the past year. Another 31% said sales were in line (41% in January), while 38% saw weaker sales than expected which was a sizable increase relative to just 15% last month.
FLI reverts to sub-50. The FLI also somewhat balanced out the headline strength seen in the overall FDI as the FLI retrenched below 50 to 47.9 (January 50.4), indicating likely contracting momentum ahead. The m/m deceleration in the FLI reflected higher inventory levels for respondents and a lower six-month outlook. On the outlook specifically, 47% of respondents predicted higher activity six months from now vs. today compared to 54% last month. The percentage anticipating similar activity was 34% compared to 36% in January, while the percentage expecting softer activity was 19% (last month 10%). This drove the six-month outlook index to register a reading of 64.1 vs. 71.8 last month.
Stable/steady demand the overwhelming theme of this month’s responses. Feedback indicated demand remained at steady levels in February: “Business seems to have stabilized.” Echoing this, another participant said, “Demand for our product continues to be consistent. While knocking on the proverbial door, 2024 is starting out very nicely.” A third participant said, it is “steady as she goes.” While accelerating market growth would clearly be preferable, we view steady demand conditions as encouraging nonetheless after a long stretch of deceleration throughout 2023. A few participants saw diverging trends from the majority with some seeing acceleration, “January was a pretty good month and February was even stronger. Seems to be some good momentum as we move in to March. Let’s go! ” and others deceleration, “A sudden drop in sales orders over the past three weeks that fall short of the January trend. This indicates a reduction in sales activity starting. Too soon to tell, but historically, we see minimal growth in an election year.”. But overall, stability seemed to rule the day in February.
Fastenal will report February daily sales on March 6th. The company earlier reported January daily sales growth of +1.6% y/y which was below our +2.6% estimate and what normal seasonality would imply. However, this was inclusive of a 1.2-1.5% headwind from weather, so absent this, we estimate sales would have been consistent with our estimate/normal seasonality. Fastener sales, specifically, were – 6.0% y/y, which decelerated vs. December (-1.9%) and marked the ninth consecutive month of either flat or declining y/y sales for this product line. Elsewhere, safety sales were +9.7% and other non-fasteners grew +3.3% y/y. For February, we are modeling +1.4% y/y daily sales growth which would be consistent with normal m/m growth. Given slight growth in the headline FDI balanced out by contraction in the FLI, we feel that normal m/m growth is achievable and a prudent assumption for FAST. For 2024 overall, we assume FAST’s growth will return to just modestly above normal seasonality in year one of an industrial recovery which we assume primarily begins in 2H24; in contrast, most of 2023 was below seasonally normal sales.
Risk Synopsis
Fastenal: Risks include economic sensitivity, pricing power, relatively high valuation, secular gross margin pressures, success of vending and on-site initiatives, and ability to sustain historical growth.
Grainger: Risks include ability to maintain margins, internet-only industrial supply sources, ability to sustain secular growth, cyclicality, and international operations.
MSC Industrial: Risks include cyclicality, maintaining and managing growth, success of Mission Critical initiative, and dual classes of stock.
Industrial Distribution: Risks include economic sensitivity, pricing power, online pressure/competitive threats, global sourcing, and exposure to durable goods manufacturing.
For the full FDI report for January 2024, with graphs and disclosures, Click-here.