Written by R.W. Baird analyst David J. Manthey, CFA with Quinn Fredrickson, CFA 9/8/23
Key Takeaway:
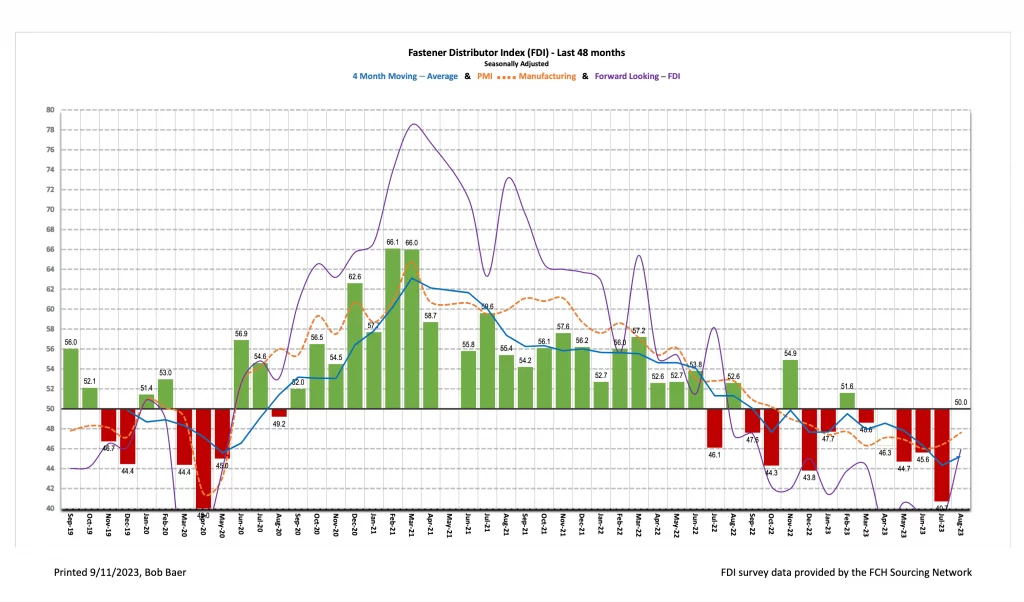
The seasonally adjusted Fastener Distributor Index (FDI) surged to a neutral reading of 50.0 compared to 40.7 in July. Respondents pointed to a rebound in demand as customers returned from summer vacations (which had pressured the July FDI). The Forward-Looking Indicator (FLI) also saw improvement but remains sub-50 at 45.9. Overall, results suggested some stabilization in fastener market conditions in August, which is encouraging after five consecutive months of declining momentum.
About the Fastener Distributor Index (FDI). The FDI is a monthly survey of North American fastener distributors, conducted with the FCH Sourcing Network and R. W. Baird. It offers insights into current fastener industry trends/outlooks. Similarly, the Forward-Looking Indicator (FLI) is based on a weighted average of four forward- looking inputs from the FDI survey. This indicator is designed to provide directional perspective on future expectations for fastener market conditions. As diffusion indexes, values above 50.0 signal strength, while readings below 50.0 signal weakness. Over time, results should be directly relevant to Fastenal (FAST) and broadly relevant to other industrial distributors such as W.W. Grainger (GWW) and MSC Industrial (MSM). Additional background is available at:FastenersClearingHouse.com.
Key Points:
FDI returns to neutral reading. The seasonally adjusted August FDI (50.0) saw substantial improvement vs. last month’s 40.7 and reached a neutral or better reading for the first time since February. Looking at the overall components of the FDI, three of the four (sales, employment, and supplier delivers) saw sequential improvement, while only customer inventories decelerated m/m. Respondents pointed to some normalization of demand following summer vacations: “Felt that customers had catching up to do after summer vacations. Sales/activity was up in August, after a very sluggish July.” This drove the seasonally adjusted sales index to improve sharply to 48.8 from last month’s very low base of 22.3. Just 37% of respondents indicated sales were below seasonal expectations compared to 70% last month. An equal number of respondents (37%) said sales were above expectations, while 26% said sales were in line.
FLI also surges but still below 50. The FLI also strengthened significantly, coming in at 45.9 vs. 38.8 last month. However, the index remains well below 50, indicating deceleration could be expected ahead. Stronger employment levels, leaner customer inventories, and a more bullish six-month outlook drove the improvement. On the outlook specifically, a lower percentage of respondents predicted lower activity levels six months from now vs. today compared to last month (20% in August, 37% in July). The percentage anticipating higher activity was unchanged (23% both this month and last), while the percentage expecting similar activity increased to 57% from 40%.
Commentary suggests uncertainty prevails. Despite the improvement seen in the FDI this month, multiple participants expressed unease on future conditions: “Too much bad ju-ju in the world. [I] am expecting a slowing of sales as people become nervous and continue to ignore the economists.” Forecasting remains challenging given the significant fluctuation in demand conditions seen month to month: “Hard to predict the upcoming months with any confidence. I would expect to see business have small peaks and valleys as the market still has not normalized yet.” Others are more encouraged by recent stabilization: “Business is steady, and forecast is same.” Passing along supplier price increases continues to be a challenge: “Our vendors prices are increasing but [we] are not expected to raise our prices. We have lost orders for less than $0.25 per part” and “Inflation is impacting many of the traditional costs of distribution in USA including labor and freight. Product sourcing prices in Taiwan are up 6%, China is slightly down, and containerized freight is down. Customers are flat and building to order vs. inventory.”
Fastenal reported August daily sales growth of +3.6%, just slightly below our +4.0% estimate and consensus expectations of +5.0%. This included fastener sales -3.8% y/y, which reflected further m/m deceleration and marked the fourth consecutive month of y/y declines. Safety sales were +9.5% and other non-fasteners grew +6.9% y/y. Looking forward, we model September daily sales +4.4% y/y which is also slightly below days-adjusted normal seasonality. This outlook is consistent with a string of sub-50 readings in the ISM and the sub-50 FLI. Beyond the near term, we assume 2024 returns to just modestly above normal seasonality in year one of an industrial recovery.
Risk Synopsis
Fastenal: Risks include economic sensitivity, pricing power, relatively high valuation, secular gross margin pressures, success of vending and on-site initiatives, and ability to sustain historical growth.
Industrial Distribution: Risks include economic sensitivity, pricing power, online pressure/competitive threats, global sourcing, and exposure to durable goods manufacturing.
For the full FDI report for August 2023, with graphs and disclosures, Click-here.