Written by R.W. Baird analyst David J. Manthey, CFA with Quinn Fredrickson, CFA 5/8/24
Key Takeaway:
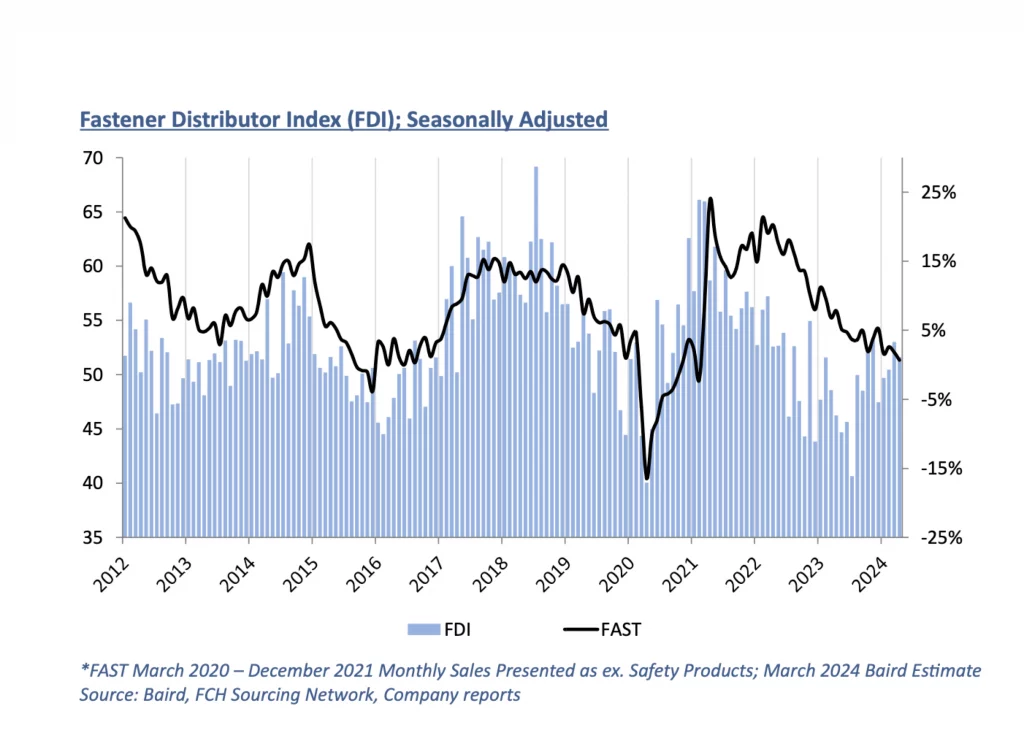
The seasonally adjusted Fastener Distributor Index (FDI) slightly decelerated m/m but remained in growth territory reading 51.6. Commentary was more mixed this month as some see pockets of significant weakness (construction, OEM, Western US markets), while others see strength (strong manufacturing and domestic/international demand). This month’s Forward-Looking Indicator (FLI), meanwhile, improved vs. last month and reached a neutral 50. When taken together with other indicators (FAST, ISM PMI), we believe market conditions in April showed improvement vs. March but remain sluggish overall.
About the Fastener Distributor Index (FDI). The FDI is a monthly survey of North American fastener distributors, conducted with the FCH Sourcing Network and R. W. Baird. It offers insights into current fastener industry trends/outlooks. Similarly, the Forward-Looking Indicator (FLI) is based on a weighted average of four forward- looking inputs from the FDI survey. This indicator is designed to provide directional perspective on future expectations for fastener market conditions. As diffusion indexes, values above 50.0 signal strength, while readings below 50.0 signal weakness. Over time, results should be directly relevant to Fastenal (FAST) and broadly relevant to other industrial distributors such as W.W. Grainger (GWW) and MSC Industrial (MSM). Additional background information is available at:FastenersClearingHouse.com.
Key Points:
FDI remains above 50 but cools off slightly m/m. After three consecutive months of improvement, the seasonally adjusted FDI dipped a bit in April to 51.6 (March 53.0). Most of the four components of the index were weaker (sales and supplier deliveries) or flat (customer inventories) m/m; only the employment index improved. Looking at the sales index specifically, 47% of respondents indicated sales came in above seasonal expectations – improving vs. 40% last month and exceeding the 31% average over the past year. However, 33% indicated sales were below expectations compared to just 13% last month, which drove the reduction in the overall sales index. The remaining 20% said sales matched expectations (vs. 47% in March).
FLI returns to neutral level. After a couple consecutive sub-50 readings, the FLI this month bounced back to a neutral level at 50.0. Higher employment levels, leaner customer inventories, and a more bullish six- month outlook drove the m/m improvement. On the outlook specifically, views leaned more positive than negative (33% expecting higher activity levels six months from now vs. today compared to 23% lower), but the plurality of respondents see similar activity continuing (43%). In March, views were exactly split (1/3 higher, 1/3 same, 1/3 lower). This drove the six-month outlook index to improve to 55.0 from 50.0.
Mixed commentary/views this month. It was hard to see a clear consensus forming this month on current trends/outlooks. Some see continued strength: “April was a very strong month. Domestic and International demand continues to grow for us. We expect to return to our 2022 sales levels which was a record year.” Said another participant, “April continued with strong demand from our customers. American manufacturing demand continues to be very strong during an election year, to our surprise.” However, some see weakness across certain key verticals, most notably construction and OEM: “Starting to witness softness in construction category, with plant closings and staff reductions at OEMs.” Echoing OEM weakness, another comment said, “April inquiries from OEM dropped significantly. Shipments have been holding steady and overseas factories are hungry for business. Federal reserve holding interest rates steady is very confusing, given the hunch status in the industrial world with business slowing everywhere.” Geographic trends seem to vary, as well: “ We’re seeing some regional slowdown, particularly in the western U.S. I’m curious if others are experiencing the same trend.” That said, some see improvement coming ahead: “Our anticipation is 2nd half of Q2 and Q3 will outpace Q1.”
Fastenal reported April day sales growth of +0.7% y/y vs. our +3.0% estimate. This was slightly below what normal seasonality would have implied for the month (+1.3%) despite a tailwind from Good Friday timing shift (fell in April last year vs. March this year). Fastener sales, specifically, were -2.2% y/y, accelerating from March’s -3.7% decline (consistent with >50 FDI) but down y/y and marking the 13th consecutive month of either flat or declining y/y sales for this product line. Elsewhere, safety sales were +5.1% and other non-fasteners grew +1.2% y/y. For May, we are modeling +3.0% y/y daily sales growth which would be slightly above normal m/m growth due to weak March and April sales for FAST. For 2024 overall, we assume FAST’s growth will be mostly in line with normal seasonality as we assume the macroeconomic/industrial cycle remains unfriendly through much of this year. Looking ahead to 2025, we have FAST growing double-digits by March in an industrial market recovery, however.
Risk Synopsis
Fastenal: Risks include economic sensitivity, pricing power, relatively high valuation, secular gross margin pressures, success of vending and on-site initiatives, and ability to sustain historical growth.
Grainger: Risks include ability to maintain margins, internet-only industrial supply sources, ability to sustain secular growth, cyclicality, and international operations.
MSC Industrial: Risks include cyclicality, maintaining and managing growth, success of Mission Critical initiative, and poor investor sentiment.
Industrial Distribution: Risks include economic sensitivity, pricing power, online pressure/competitive threats, global sourcing, and exposure to durable goods manufacturing.
For the full FDI report for April 2024, with graphs and disclosures, Click-here.