Fastener Distributor Index – Report #165 September 2025
Written by R.W. Baird analyst David J. Manthey, CFA with Quinn Fredrickson, CFA 10/7/25
Key Takeaway:
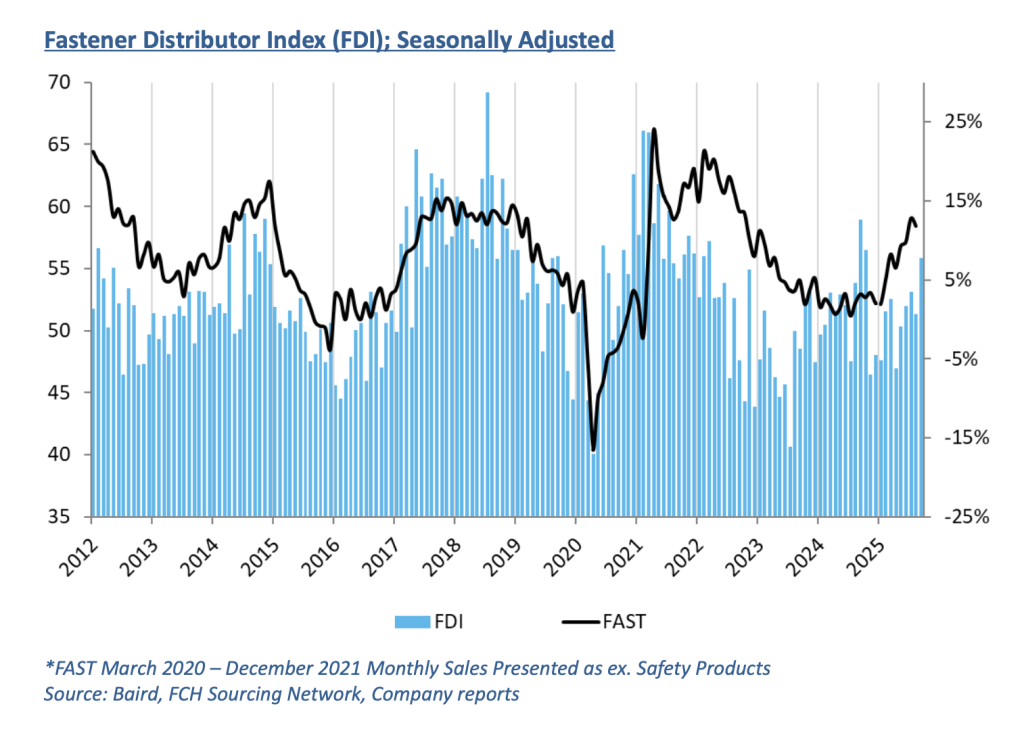
The seasonally adjusted Fastener Distributor Index (FDI) saw solid m/m improvement to 55.8 (August 51.3). Stronger sales and customer inventories drove the improvement. The Forward-Looking Indicator (FLI), however, dipped for the second consecutive month and dropped below 50 (48.9) amid weaker employment, higher inventory levels, and a softer six-month outlook. Respondent commentary pointed to resilient September trends despite continued uncertainty from tariffs, though largely a cautious/uncertain outlook given tariff and consumer sentiment headwinds.
About the Fastener Distributor Index (FDI). The FDI is a monthly survey of North American fastener distributors, conducted with the FCH Sourcing Network and R. W. Baird. It offers insights into current fastener industry trends/outlooks. Similarly, the Forward-Looking Indicator (FLI) is based on a weighted average of four forward- looking inputs from the FDI survey. This indicator is designed to provide directional perspective on future expectations for fastener market conditions. As diffusion indexes, values above 50.0 signal strength, while readings below 50.0 signal weakness. Over time, results should be directly relevant to Fastenal (FAST) and broadly relevant to other industrial distributors such as W.W. Grainger (GWW) and MSC Industrial (MSM). Additional background information is available at:FastenersClearingHouse.com.
Key Points:
FDI moves into the mid-50s. This month, the index saw nice m/m improvement to 55.8 from last month’s 51.3. The 55.8 is the strongest FDI reading since pre–Liberation Day (October 2024). Seasonally-adjusted sales trends were strong, with the index at a robust 70.4 compared to just 53.0 last month. While the seasonal adjustment factor played a large role this month, the underlying (non-seasonally adjusted) sales index was also strong at 58.1. 48% of respondents said sales were above seasonal norms, which is above average levels over the past year (38%). Of course, higher pricing plays a role in the sales performance, as pricing increased m/m for 52% of participants and 90% y/y. The percentage of respondents seeing higher pricing m/m continued to somewhat moderate, however, to 52% (61% in August, 65% in July, and 66% in June) – perhaps signaling some early stabilization in pricing as tariffs have been passed along. Employment levels continued to be a slight m/m drag on the index for the second consecutive month, as the share of participants saying employment was “lower than seasonal norms” increased to 16% from 6% last month, though the overwhelming majority (65%) say employment levels are in line. Supplier lead times were relatively unchanged m/m and had minimal impact on the index this month.
FLI continues to decline, however. The Forward-Looking Indicator (FLI) declined to 48.9 in September from 54.3 in August. This marked the first sub-50 reading since June. The m/m moderation reflected lower employment, higher respondent and customer inventory levels, and a more pessimistic six-month outlook. Regarding the outlook specifically, just 29% now forecast better trends six months from now compared to today, which is down from 39% in August and the 43% average throughout 2024. Conversely, 39% forecast lower activity levels six months from now, which was an increase from 27% in August. The remaining 32% anticipate stable momentum (vs. 33% last month). The ISM PMI, meanwhile, continues to suggest near-term contraction in the industrial economy, with September coming in at 49.1, although the PMI similarly saw m/m improvement (consistent with the FDI).
September feedback mostly positive but outlook uncertain. Commentary on September largely suggested that it was a surprisingly solid month: “September was a good month for incoming orders and Q3 was another record high in shipments. [I] don’t know how long the tailwinds will last, but we’re ready to ride them.” Similarly, another participant said, “Despite all of the political headwinds, our business continues to grow, and we expect the end of the year and beginning of next year to be positive for our business.” Others saw September as merely an “average month”: “September was just an average month, nothing horrible and nothing stellar. I will take that small profit as a win.” For participants with exposure to data centers, this booming market continues to power growth despite broader uncertainty: “Tariffs continue to present challenges since there is still a certain amount of mystery surrounding them and where the final numbers will land. Our data center business is at an all-time high and we expect this to continue into the future.” On the subject of tariffs, some participants see an impending significant headwind to sales/activity coming as pre-tariff inventories evaporate: “The tariffs are slowly coming home to roost and it’s impacting customers. Many are reducing SKUs to reduce fastener consumption. New construction starts are going to fall, so say our local builders who say they’re going to finish up and start laying off crews. Prices are really going up because pre-tariff inventories are vanishing.” Similarly, “with all the uncertainty still remaining with trade policy, [it] feels like customers will remain cautious with purchases, and consumer sentiment [indicators] are trending down which will lead to lower demand.”
Fastenal reported August daily sales +11.8% y/y, below our more aggressive +15.6% estimate but also slightly below what normal seasonality would have implied coming off a very strong July. Consistent with the m/m moderation in the FDI, fastener sales decelerated to 13.3% growth (from +14.6% in July). Elsewhere, safety sales were +10.2% and other non-fasteners grew +11.5% y/y. For September, we are modeling a further moderation to +9.7% y/y daily sales growth, which reflects mostly normal seasonality and further pricing lift from tariffs. September will be reported with 3Q25 earnings October 13th.
Risk Synopsis
Fastenal: Risks include economic sensitivity, pricing power, relatively high valuation, secular gross margin pressures, success of vending and on-site initiatives, and ability to sustain historical growth.
Grainger: Risks include ability to maintain margins, internet-only industrial supply sources, ability to sustain secular growth, cyclicality, and international operations.
MSC Industrial: Risks include cyclicality, maintaining and managing growth, success of Mission Critical initiative, and poor investor sentiment.
Industrial Distribution: Risks include economic sensitivity, pricing power, online pressure/competitive threats, global sourcing, and exposure to durable goods manufacturing.
Appendix – Important Disclosures and Analyst Certification
Covered Companies Mentioned
All stock prices below are as of 10/6/2025.
Fastenal Company (FAST-$47.90-Outperform)
W.W. Grainger Inc. (GWW-$956.59-Outperform)
MSC Industrial Direct Co. Inc (MSM-$91.99-Neutral)
For the full FDI report for September 2025, with graphs and disclosures, Click-here.
.