Written by R.W. Baird analyst David J. Manthey, CFA with Quinn Fredrickson, CFA 7/7/25
Key Takeaway:
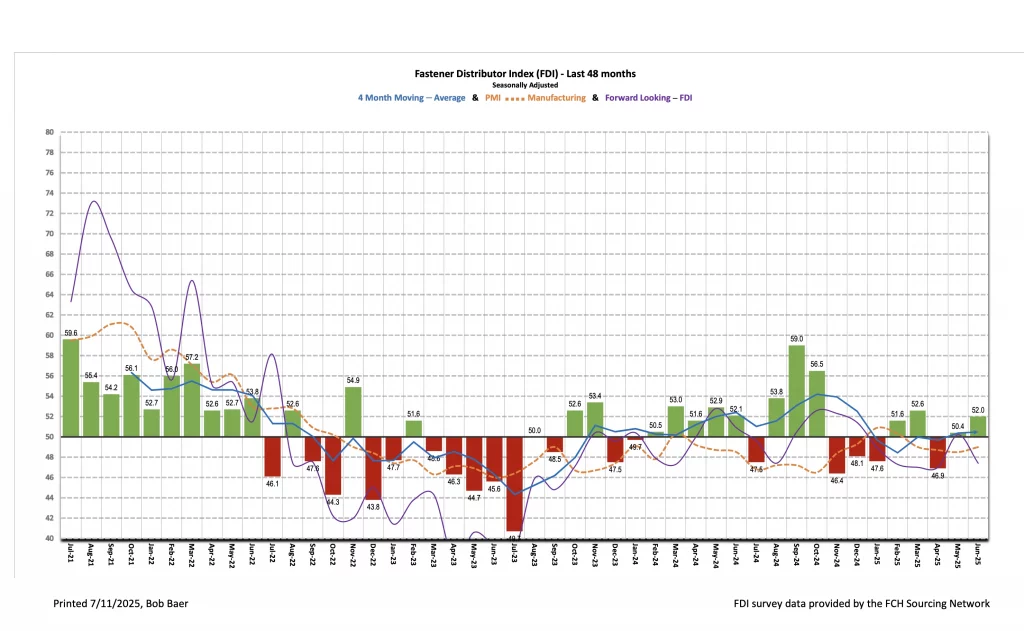
The seasonally adjusted Fastener Distributor Index (FDI) improved sequentially for the second consecutive month, reaching 52.0 (May 50.4), reflecting re-acceleration in sales and customer inventories. However, the Forward-Looking Indicator (FLI) fell back below 50, landing at 47.4 (vs. May’s 50.2), consistent with softer February-April readings. Overall, June showed a mixed picture after a relatively more constructive May, with commentary reflecting mixed signals on demand and persistent uncertainty tied to trade disruptions.
About the Fastener Distributor Index (FDI). The FDI is a monthly survey of North American fastener distributors, conducted with the FCH Sourcing Network and R. W. Baird. It offers insights into current fastener industry trends/outlooks. Similarly, the Forward-Looking Indicator (FLI) is based on a weighted average of four forward- looking inputs from the FDI survey. This indicator is designed to provide directional perspective on future expectations for fastener market conditions. As diffusion indexes, values above 50.0 signal strength, while readings below 50.0 signal weakness. Over time, results should be directly relevant to Fastenal (FAST) and broadly relevant to other industrial distributors such as W.W. Grainger (GWW) and MSC Industrial (MSM). Additional background information is available at:FastenersClearingHouse.com.
Key Points:
FDI improved month over month, still above 50. The June seasonally adjusted FDI improved to 52.0 (vs. May 50.4), marking the second highest monthly FDI reading in 2025 YTD (March may have been impacted by some pre-buy ahead of tariffs). Two of the four underlying factors (sales and customer inventories) saw m/m improvement in June; supplier deliveries moderated m/m while remaining above 50, while employment was the only factor that posted an outright decline (sub-50 reading). The sales index reached 60.5 in June, up from 49.2 in May, signaling improving momentum. Furthermore, 41% of respondents indicated sales came in above seasonal expectations, which is higher than the 34% average registered over the past year. This month, 22% indicated sales were below expectations (down considerably vs. 39% last month) and another 38% said in line (vs. 21% last month). Customer inventories were also a contributor to the expansion, as the share of participants saying “lower than seasonal norms” decreased m/m (from 27% to 13%), though the overwhelming majority (72%) continue to say customer inventories are in line. Employment levels moderated, with the 46.9 FDI employment index a step down from last month’s 51.5 reading. Meanwhile, a majority of respondents this month said pricing was higher vs. May (66% vs. 64% last month) and also follows 64% in April, 61% in March, 48% in February, and just 17% in January. Year-to-year pricing also ticked lower, reaching 92.2 compared to 92.4 in May, though still meaningfully reflecting growth.
FLI slides back below 50. The FLI registered a 47.4 reading, creeping lower from May’s 50.2. The ISM PMI Manufacturing Index shows similar directional trends, with four consecutive sub-50 readings after a brief run of >50 readings in January/February. Respondent commentary also points to continued uncertainty among customers and hesitant buying patterns that are almost exclusively focused on tariffs rather than growth. Quantitatively, the six-month outlook was slightly better, however, as 41% of participants forecast better activity levels over the next six months vs. today, while 22% see lower and another 38% forecast stable trends. Net, we see this as more optimistic on balance than in May when 33% forecast acceleration, 42% stable, and 24% expected sales to deteriorate further.
Tariffs remained the dominant theme in June. Respondents reported widespread uncertainty, rising costs, and growing disruption to both purchasing and pricing behavior. While a few distributors continued to report solid sales trends, commentary was notably more cautious this month, with many flagging potential demand softening and growing customer hesitation. Several respondents cited ongoing sales momentum: “Through the first 6-months of 2025, our sales are up 50% over 2024,” and “Quarter 2 is closing well” — but noted signs of slowing: “Bookings seem to be slow. Several customers have July shutdowns scheduled,” and “Ho Hum sales in June.” Others pointed to end-market caution: “Seems like last month’s jump = this month’s scale back.” One respondent added, “End user demand remains sluggish — June 4th tariffs precipitating another price increase.”
Tariff confusion and rising costs were recurring frustrations. One participant wrote, “Tariffs continue to burn time and are now more confusing than ever… Customs is very slow to clear product and brokers don’t fully understand the rules. All in all, chaos.” Another flagged the complexity of calculating overlapping codes: “There are at least 2-3 differing opinions on how to calculate the 310, 232 and whether or not to ‘stack’ on IEEPA.” Customers appear to be pulling back as a result: “Tariffs and interest rates have affected our customer spending since February 1, 2025,” and “we are holding back on major infrastructure purchases because of tariffs and cost increases.” Pricing pressure was another common theme. “Due to Section 232 tariffs, [cost of goods] is about 50% on average higher year/year,” said one respondent. Another echoed, “Section 232 has caused uncertainty in pricing parts. Demand overall remains strong, otherwise.” In another case, rising costs are expected to create further disruption: “We are expecting to see supply chain issues in the next several months through the end of year.”The tone of several comments reflected broader concern over economic implications: “While things are trending back up, the tariff-related trade war will ultimately cause our economy to tank. History doesn’t lie. Those who don’t learn from the past are doomed to repeat it.” Net, while core demand trends are not collapsing, commentary suggests increasing strain from tariff-related costs, customer push-outs, and pricing confusion. Forward visibility appears limited, with a growing number of participants sounding more cautious heading into the back half of the year.
Fastenal reported May daily sales growth of +9.3% y/y, just below our +10.9% estimate but 2% above what normal seasonality would have implied for the month. Consistent with the >50 FDI, fastener sales accelerated to 8.9% growth (from +1.5% in April). Elsewhere, safety sales were +10.4% and other non-fasteners grew +9.2% y/y. For June, we are modeling a further improvement in trend to +9.9% y/y daily sales growth, which mostly reflects better-than-normal seasonality but also further pricing from tariffs.
FAST will report June ADS with 2Q25 results on July 14.
Risk Synopsis
Fastenal: Risks include economic sensitivity, pricing power, relatively high valuation, secular gross margin pressures, success of vending and on-site initiatives, and ability to sustain historical growth.
Grainger: Risks include ability to maintain margins, internet-only industrial supply sources, ability to sustain secular growth, cyclicality, and international operations.
MSC Industrial: Risks include cyclicality, maintaining and managing growth, success of Mission Critical initiative, and poor investor sentiment.
Industrial Distribution: Risks include economic sensitivity, pricing power, online pressure/competitive threats, global sourcing, and exposure to durable goods manufacturing.
For the full FDI report for June 2025, with graphs and disclosures, Click-here.