Written by R.W. Baird analyst David J. Manthey, CFA with Quinn Fredrickson, CFA 7/8/24
Key Takeaway:
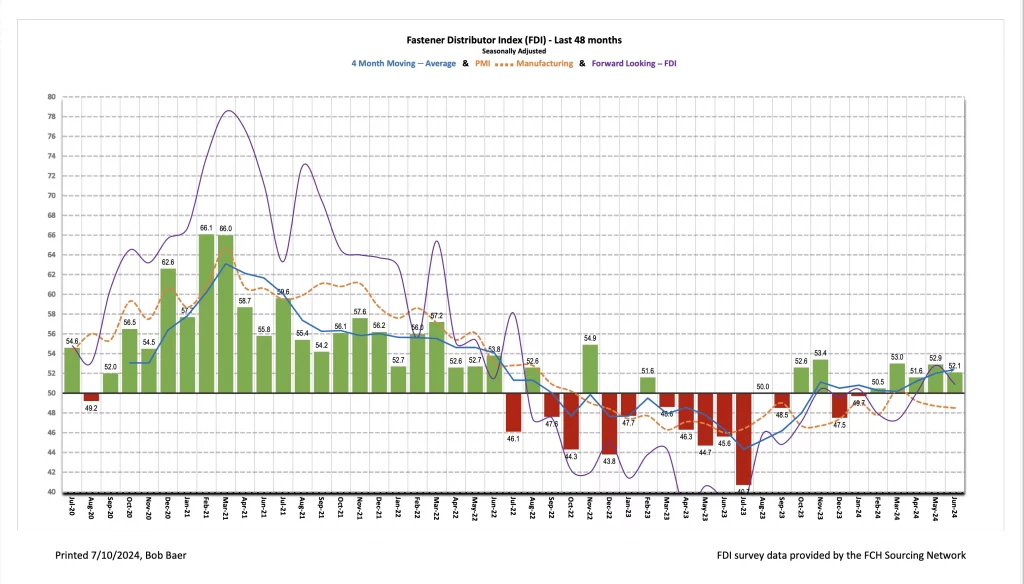
The seasonally adjusted Fastener Distributor Index (FDI) saw a slight m/m decline, 52.1 vs. 52.9 in May, but remained in expansionary territory (>50). Commentary was mixed as some saw good order trends, while others characterized June as fairly weak. Looking ahead, this month’s Forward-Looking Indicator (FLI) also slightly weakened vs. last month and remains just barely above the Mendoza line (50) at 50.9, although outlook commentary leaned net positive. When taken together with other indicators (recent FAST monthly sales, May/June ISM PMI), we believe fastener market conditions remain fairly soft, with June slightly worse in aggregate than May.
About the Fastener Distributor Index (FDI). The FDI is a monthly survey of North American fastener distributors, conducted with the FCH Sourcing Network and R. W. Baird. It offers insights into current fastener industry trends/outlooks. Similarly, the Forward-Looking Indicator (FLI) is based on a weighted average of four forward- looking inputs from the FDI survey. This indicator is designed to provide directional perspective on future expectations for fastener market conditions. As diffusion indexes, values above 50.0 signal strength, while readings below 50.0 signal weakness. Over time, results should be directly relevant to Fastenal (FAST) and broadly relevant to other industrial distributors such as W.W. Grainger (GWW) and MSC Industrial (MSM). Additional background information is available at:FastenersClearingHouse.com.
Key Points:
FDI slightly softer m/m. The June seasonally adjusted FDI declined to a reading of 52.1 compared to 52.9 in May. Three of the four underlying components (sales, employment, and customer inventories) decelerated vs. May; only the supplier deliveries index improved by a very modest amount. Looking at the sales index specifically, just 29% of respondents indicated sales came in above seasonal expectations – slightly lower vs. 36% last month and below the 33% average over the past year. 26% indicated sales were below expectations compared to 27% last month, while the remaining 45% said sales matched expectations (vs. 36% in May).
FLI also slightly weaker but remains above 50. Consistent with the FDI, the FLI also suggests improvement is expected ahead, albeit at a decelerating rate. Versus last month, the FLI decreased to 50.9 (May 52.8), but at above 50.0, continues to signal an expectation for expansion in future market activity levels. While slightly leaner customer inventory levels and a more optimistic six-month outlook were positives this month, the FLI decelerated based on higher respondent inventories and weaker employment levels. On the outlook specifically, views again leaned net more positive than negative (45% expecting higher activity levels six months from now vs. today compared to 19% lower). Importantly, the 45% expecting higher activity now represents the plurality of respondents, with the remaining 35% of respondents forecasting similar trends. In May, 39% expected higher activity, 42% similar, and 18% lower. This drove the six-month outlook index to improve to 62.9 from 60.6 this month.
Feedback very uneven on current trends but outlook feedback mostly positive. It was difficult to gauge much of a consensus this month, as views were quite divergent. Some saw healthy sales/orders: “After a great year, followed by one bad month in May, June looked good again.” Said another respondent, “June was a brisk month of activity. Still hoping that it continues as we inch closer to the election activity.” And a third participant: “June was a good month for both incoming orders and shipments. We are a bit worried about Q3 & Q4 but remain optimistic. Listening to the whispers business seems to be slowing everywhere in our industry.” However, others saw softness in June, which may have reflected some Summer vacations and/or election nerves: “We are seeing a noticeable slowdown all of a sudden. Some it is the pre-election jitters. Neither guy is going to do our industry any favors. Plus the start of the summer vacation rush is always slow.” Echoing this, another comment indicated, “Incoming order rate in June was lower than previous months – lowest this year with the exception of January. We are hoping this is not a trend.” Others saw good orders but lower sales dollars: “More sales orders, but less sales dollars. Working harder for less.” Still, looking forward, commentary seemed to lean more optimistic: “End customer activity continues to be a mixed bag. Regardless if up, down, or flat, most are feeling okay about their business outlook, and some are preparing for a tightening supply chain going into 2025. Where things are sluggish, inventory overhang is a common theme. The destocking trend that began in earnest in 2024 is taking longer than most of us expected… but it will finish and some lift in demand for components will occur, which is going to be a contributing factor to stronger sales in CY’25.” Some see this month’s trends as the floor for the current cycle: “Business in the first half could have been (per plan, should have been) better, but also could have been worse. Customers are reporting a stable demand environment and real progress on destocking so it feels like the stage is set for this to be the floor for this cycle.”
Fastenal reported May day sales growth of +1.5% y/y vs. our +2.5% estimate. This was also 1% below what normal seasonality would have implied for the month. Fastener sales, specifically, were -4.1% y/y, softening from April’s -2.2% decline and marking the 14th consecutive month of either flat or declining y/y sales for this product line. Elsewhere, safety sales were +7.5% and other non-fasteners grew +3.0% y/y. For June, we are modeling +3.7% y/y daily sales growth which is in line with normal days-adjusted seasonality. FAST will report June ADS with 2Q24 results on 7/12.
Risk Synopsis
Fastenal: Risks include economic sensitivity, pricing power, relatively high valuation, secular gross margin pressures, success of vending and on-site initiatives, and ability to sustain historical growth.
Grainger: Risks include ability to maintain margins, internet-only industrial supply sources, ability to sustain secular growth, cyclicality, and international operations.
MSC Industrial: Risks include cyclicality, maintaining and managing growth, success of Mission Critical initiative, and poor investor sentiment.
Industrial Distribution: Risks include economic sensitivity, pricing power, online pressure/competitive threats, global sourcing, and exposure to durable goods manufacturing.
For the full FDI report for June 2024, with graphs and disclosures, Click-here.