Written by R.W. Baird analyst David J. Manthey, CFA with Quinn Fredrickson, CFA 8/8/24
Key Takeaway:
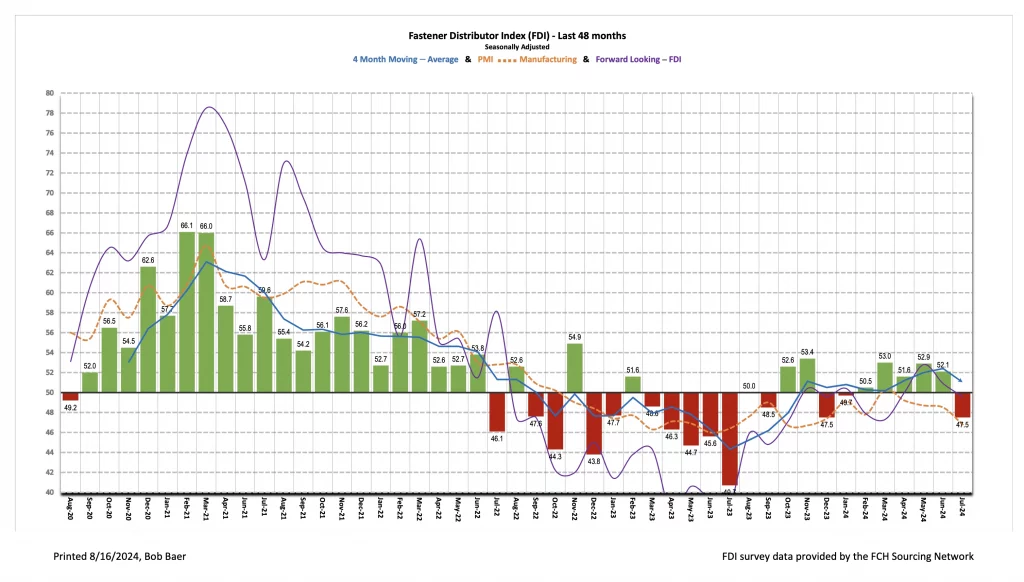
The seasonally adjusted Fastener Distributor Index (FDI) dipped to 47.5, below 50 for the first time since January. While normal summer sluggishness likely played a role, several participants said they saw signs of a broader slowdown beyond just seasonal weakness. Consistent with this, this month’s Forward- Looking Indicator (FLI) was also slightly lower m/m, with a 49.6 reading. When taken together with other indicators (soft July ISM PMI, recent weak jobs report, weak FAST July sales, and stock market volatility), we believe fastener market conditions and the industrial economy in general were soft in July.
About the Fastener Distributor Index (FDI). The FDI is a monthly survey of North American fastener distributors, conducted with the FCH Sourcing Network and R. W. Baird. It offers insights into current fastener industry trends/outlooks. Similarly, the Forward-Looking Indicator (FLI) is based on a weighted average of four forward- looking inputs from the FDI survey. This indicator is designed to provide directional perspective on future expectations for fastener market conditions. As diffusion indexes, values above 50.0 signal strength, while readings below 50.0 signal weakness. Over time, results should be directly relevant to Fastenal (FAST) and broadly relevant to other industrial distributors such as W.W. Grainger (GWW) and MSC Industrial (MSM). Additional background information is available at:FastenersClearingHouse.com.
Key Points:
FDI below 50 for first time since January. The July seasonally adjusted FDI declined to a reading of 47.5 compared to 52.1 in June. This was the first sub-50 reading (indicating contraction in market activity) since January. Three of the four underlying components (sales, employment, and supplier deliveries) weakened vs. June; only the customer inventories index improved by a slight amount. Looking at the sales index specifically, just 22% of respondents indicated sales came in above seasonal expectations compared to 29% last month and the 34% average over the past year. 47% said sales were below expectations, which was the highest percentage since July 2023 (70%) and compared to 26% last month, while the remaining 31% said sales matched expectations (vs. 45% in June).
FLI also back below 50. Consistent with the FDI, the FLI also saw m/m softening and now suggests further weakening is expected ahead. Compared to last month, the FLI decreased to 49.6 (June 50.9), which at below 50.0, signals an expectation for contraction in future market activity levels. All four sub- components of the index contributed to the m/m contraction, with slightly lower employment levels, higher respondent and customer inventories, and a lower six-month outlook driving the deceleration. On the outlook specifically, views again leaned net more positive than negative (38% expecting higher activity levels six months from now vs. today compared to 31% lower) but at a narrower gap than prior months (May/June had a 24% net more optimistic outlook). The remaining 31% of participants forecast similar activity. In June, 45% expected higher activity, 35% similar, and 19% lower. This drove the six- month outlook index to weaken to just 53.1 from 62.9 last month.
Feedback leans net cautious this month. While a handful of participants saw healthy trends in July and remain upbeat (“July average daily sales showed improvement over June and overall Q2 and were more consistent day-to-day than we’ve seen this year. Our core customer base is perking up, a trend we expect to continue as the rest of this year unspools.”), most comments had a cautious tone on current trends/near-term outlook. Said one participant, “Lots of uncertainty in the markets due to factors such as war, election, energy prices, etc. We are hiring for some technical positions in the expectation that 2025 will be a solid year.” Echoing this, another comment was “Definite decline in our July incoming order rate. We hope things pick up after the summer slowdowns.” While seasonal softness in the Summer is not unusual, some expressed a belief the weak July reflected more than this: “Business in July is typically a little slower to begin with due to vacations, mid-year inventory balancing, etc. But this July saw a drop in inquiries and incoming OEM orders that we have not seen in 5 years. Business is slowing everywhere and customers still have inventory. On the plus side, pricing has relaxed a bit. On the flip side, when it turns back, there will likely be a rush of orders flooding the market at the same time and pricing will likely increase.” Others see too-high inventory levels in the channel as the culprit: “Distributors inventory levels are creating increased competition for parts availability.” While some see new entrants to the market causing challenges: “We’re starting to see signs of the much-threatened slowdown. We are also seeing more local (new) competitors open and they have no idea what they are doing. They aren’t disrupting the market but damaging it. That’s always bad.” Fears about the broader US economy also influenced sentiment this month: “We are worried about the economy over the 12 months but we continue to rollout new business.”
Fastenal reported July day sales growth of +0.5% y/y vs. our +2.0% estimate. This was also 2.1% below what normal seasonality would have implied for the month. Fastener sales, specifically, were -6.3% y/y, softening from June’s -2.7% decline and marking the 15th consecutive month of either flat or declining y/y sales for this product line. Elsewhere, safety sales were +7.5% and other non-fasteners grew +1.6% y/y. For August, we are modeling +2.4% y/y daily sales growth which is in line with normal days-adjusted seasonality.
Risk Synopsis
Fastenal: Risks include economic sensitivity, pricing power, relatively high valuation, secular gross margin pressures, success of vending and on-site initiatives, and ability to sustain historical growth.
Grainger: Risks include ability to maintain margins, internet-only industrial supply sources, ability to sustain secular growth, cyclicality, and international operations.
MSC Industrial: Risks include cyclicality, maintaining and managing growth, success of Mission Critical initiative, and poor investor sentiment.
Industrial Distribution: Risks include economic sensitivity, pricing power, online pressure/competitive threats, global sourcing, and exposure to durable goods manufacturing.
For the full FDI report for July 2024, with graphs and disclosures, Click-here.