Written by R.W. Baird analyst David J. Manthey, CFA with Quinn Fredrickson, CFA 8/7/25
Key Takeaway:
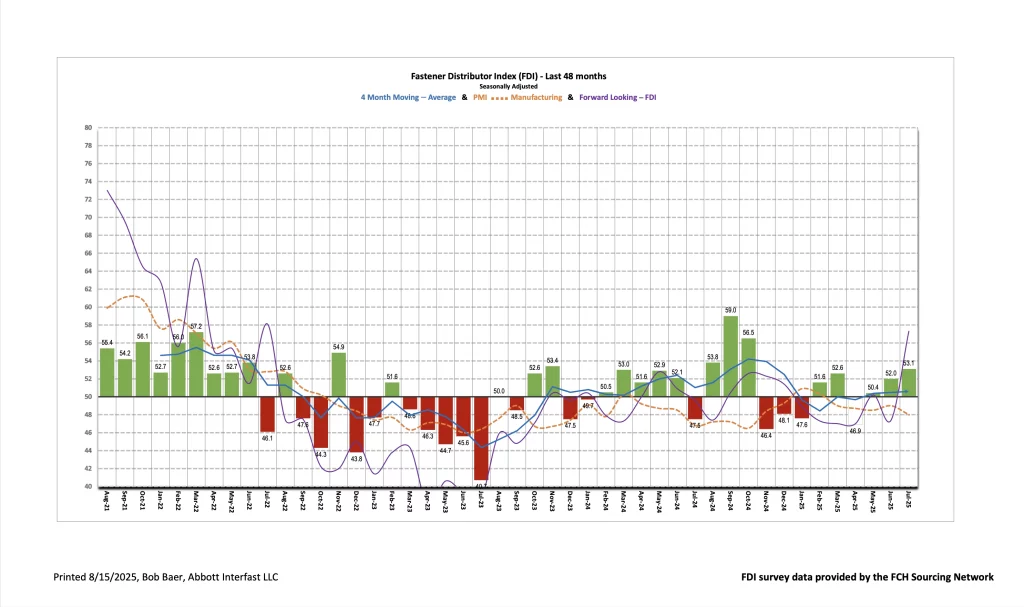
The seasonally adjusted Fastener Distributor Index (FDI) continued to move higher in July, reaching 53.1 (June 52.0), reflecting slightly better seasonally-adjusted sales trends and higher employment. The Forward-Looking Indicator (FLI) was even more positive, coming in sharply higher m/m at 57.3 (June 47.4). Respondent commentary suggests tariffs remain challenging to navigate, with more domestically oriented players appearing less constrained by related overheads. On balance, results suggest it was a solid month for most participants, particularly on the revenue side, though margins may be slipping.
About the Fastener Distributor Index (FDI). The FDI is a monthly survey of North American fastener distributors, conducted with the FCH Sourcing Network and R. W. Baird. It offers insights into current fastener industry trends/outlooks. Similarly, the Forward-Looking Indicator (FLI) is based on a weighted average of four forward- looking inputs from the FDI survey. This indicator is designed to provide directional perspective on future expectations for fastener market conditions. As diffusion indexes, values above 50.0 signal strength, while readings below 50.0 signal weakness. Over time, results should be directly relevant to Fastenal (FAST) and broadly relevant to other industrial distributors such as W.W. Grainger (GWW) and MSC Industrial (MSM). Additional background information is available at:FastenersClearingHouse.com.
Key Points:
FDI continues to steadily improve. This month, we saw another steady m/m improvement in the index, with the seasonally adjusted FDI coming in at 53.1 (vs. June 52.0). Seasonally-adjusted sales trends improved vs. last month, with the index reaching 64.5 (June 60.5). 41% of respondents again this month indicated sales were above seasonal expectations, matching June and slightly higher than the 36% average registered over the past year. Of course, higher pricing played a role in the sales performance, as pricing increased m/m for 65% of participants and 88% y/y. Employment levels were also a slight contributor to the expansion, as the share of participants saying employment was “lower than seasonal norms” decreased m/m (from 16% to 9%), though the overwhelming majority (71%) continue to say employment levels are in line. Customer inventory levels were a drag on this month’s performance (index moderated from 51.6 to just 38.2) but could bode well for future growth, with 32% of participants now saying customer inventory levels are too low.
FLI nicely rebounds back above 50. After retrenching below 50 in June (47.4), the FLI registered a 57.3 reading this month. The m/m expansion reflected lower customer inventories, higher employment levels, and a moderately higher six-month outlook. That said, there seemed to be a large discrepancy in sentiment/results between more domestically oriented players vs. more globally oriented, which is likely resulting in a bit higher FLI than the results/outlook would suggest for some in the survey. The ISM PMI, meanwhile, continues to suggest contraction in the industrial economy, with July coming in at 48.0. Regarding the outlook specifically, the six-month outlook was slightly better compared with June primarily due to a proportionately smaller percentage of respondents forecasting lower activity levels six months from now vs. today; this was 22% in June but just 15% in July. 47% of respondents anticipate similar activity levels and 38% are forecasting improvement.
Mixed feedback depending on domestic vs. global sourcing exposure. Commentary was mixed, as some – primarily those with domestic sourcing – continue to see strong relative results: “Just like last month, we received an unexpectedly large amount of orders and we pushed them out the door for a great sales month. I am bullish on USA-made parts.” Echoing this dichotomy, another participant said, “From what we hear, the American fastener guys are busy while the metric side is a little slower.” A third participant said conditions are “steady and [we are] optimistic.” For some, while July was not as strong as June, results were characterized as reasonably healthy nonetheless: “Sales were down a bit in July as compared to June but July was still our 2nd largest sales month in company history.” Conversely, others – presumably with more global sourcing – have seen significant challenges from tariffs: “Tariff uncertainty is still driving prices up while stifling demand.” Constantly changing tariffs also present difficulties, especially on margins: “Managing inventory by Tariff category has practically created an additional position as OEM customers ask for detailed breakdowns and inventory pricing by tariff change. Each time our President decides to change them or make a new deal, we find ourselves starting over. Planning is impossible. Sales are up, of course due to the increased tariff pricing, but margins are taking a substantial hit as we share the increased cost with customers to save the relationship and assist them with holding their own product cost increases to a minimum.” Coupled with tariffs, the broader economic uncertainty also has some feeling more cautious: “Strong signs that the economy is slowing. Also, with regards to your pricing question, it varies by product category as the evil tariffs apply. Some stuff has gone up a lot whilst other items are only up about 15%.”
Fastenal reported July daily sales growth of +12.8% y/y, just above our +12.3% estimate and better than what normal seasonality would have implied for the month. Consistent with the >50 FDI, fastener sales accelerated to 14.6% growth (from +9.5% in June). Elsewhere, safety sales were +11.7% and other non-fasteners grew +12.0% y/y. For August, we are modeling a further improvement in trend to +15.6% y/y daily sales growth, which reflects better-than-normal seasonality amid further pricing from tariffs.
Risk Synopsis
Fastenal: Risks include economic sensitivity, pricing power, relatively high valuation, secular gross margin pressures, success of vending and on-site initiatives, and ability to sustain historical growth.
Grainger: Risks include ability to maintain margins, internet-only industrial supply sources, ability to sustain secular growth, cyclicality, and international operations.
Appendix – Important Disclosures and Analyst Certification Covered Companies Mentioned
All stock prices below are as of 8/7/2025.
Fastenal Company (FAST-$46.83-Outperform)
W.W. Grainger Inc. (GWW-$957.35-Outperform)
MSC Industrial Direct Co. Inc (MSM-$85.43-Neutral)
For the full FDI report for July 2025, with graphs and disclosures, Click-here.